
You also want an ePaper? Increase the reach of your titles
YUMPU automatically turns print PDFs into web optimized ePapers that Google loves.
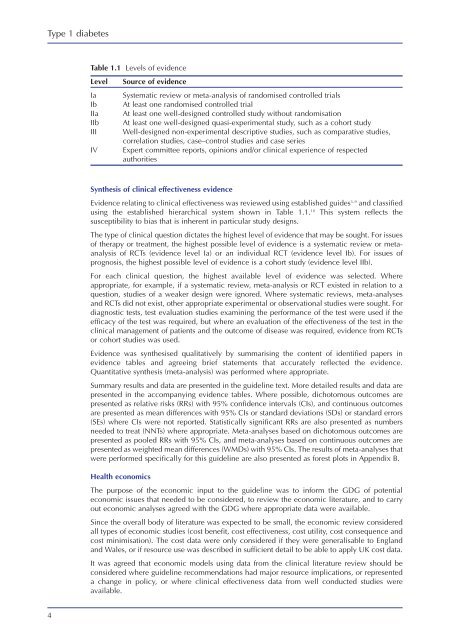
<strong>Type</strong> 1 <strong>diabetes</strong>Table 1.1 Levels of evidenceLevelIaIbIIaIIbIIIIVSource of evidenceSystematic review or meta-analysis of randomised controlled trialsAt least one randomised controlled trialAt least one well-designed controlled study without randomisationAt least one well-designed quasi-experimental study, such as a cohort studyWell-designed non-experimental descriptive studies, such as comparative studies,correlation studies, case–control studies and case seriesExpert committee reports, opinions and/or clinical experience of respectedauthoritiesSynthesis of clinical effectiveness evidenceEvidence relating to clinical effectiveness was reviewed using established guides 3–9 and classifiedusing the established hierarchical system shown in Table 1.1. 10 This system reflects thesusceptibility to bias that is inherent in particular study designs.The type of clinical question dictates the highest level of evidence that may be sought. For issuesof therapy or treatment, the highest possible level of evidence is a systematic review or metaanalysisof RCTs (evidence level Ia) or an individual RCT (evidence level Ib). For issues ofprognosis, the highest possible level of evidence is a cohort study (evidence level IIb).For each clinical question, the highest available level of evidence was selected. Whereappropriate, for example, if a systematic review, meta-analysis or RCT existed in relation to aquestion, studies of a weaker design were ignored. Where systematic reviews, meta-analysesand RCTs did not exist, other appropriate experimental or observational studies were sought. Fordiagnostic tests, test evaluation studies examining the performance of the test were used if theefficacy of the test was required, but where an evaluation of the effectiveness of the test in theclinical management of patients and the outcome of disease was required, evidence from RCTsor cohort studies was used.Evidence was synthesised qualitatively by summarising the content of identified papers inevidence tables and agreeing brief statements that accurately reflected the evidence.Quantitative synthesis (meta-analysis) was performed where appropriate.Summary results and data are presented in the guideline text. More detailed results and data arepresented in the accompanying evidence tables. Where possible, dichotomous outcomes arepresented as relative risks (RRs) with 95% confidence intervals (CIs), and continuous outcomesare presented as mean differences with 95% CIs or standard deviations (SDs) or standard errors(SEs) where CIs were not reported. Statistically significant RRs are also presented as numbersneeded to treat (NNTs) where appropriate. Meta-analyses based on dichotomous outcomes arepresented as pooled RRs with 95% CIs, and meta-analyses based on continuous outcomes arepresented as weighted mean differences (WMDs) with 95% CIs. The results of meta-analyses thatwere performed specifically for this guideline are also presented as forest plots in Appendix B.Health economicsThe purpose of the economic input to the guideline was to inform the GDG of potentialeconomic issues that needed to be considered, to review the economic literature, and to carryout economic analyses agreed with the GDG where appropriate data were available.Since the overall body of literature was expected to be small, the economic review consideredall types of economic studies (cost benefit, cost effectiveness, cost utility, cost consequence andcost minimisation). The cost data were only considered if they were generalisable to Englandand Wales, or if resource use was described in sufficient detail to be able to apply UK cost data.It was agreed that economic models using data from the clinical literature review should beconsidered where guideline recommendations had major resource implications, or representeda change in policy, or where clinical effectiveness data from well conducted studies wereavailable.4