The effect of high-pressure cooling in pig houses - Skov A/S
The effect of high-pressure cooling in pig houses - Skov A/S
The effect of high-pressure cooling in pig houses - Skov A/S

Create successful ePaper yourself
Turn your PDF publications into a flip-book with our unique Google optimized e-Paper software.
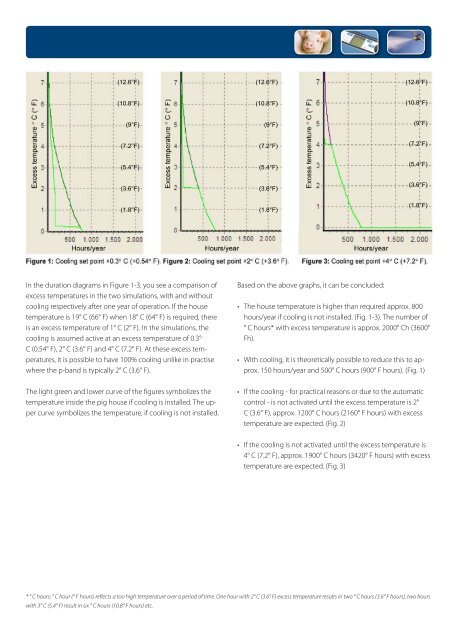
(12.6°F)(12.6°F)(12.6°F)(10.8°F)(10.8°F)(10.8°F)(9°F)(9°F)(9°F)(7.2°F)(7.2°F)(7.2°F)(5.4°F)(5.4°F)(5.4°F)(3.6°F)(1.8°F)(3.6°F)(1.8°F)(3.6°F)(1.8°F)In the duration diagrams <strong>in</strong> Figure 1-3, you see a comparison <strong>of</strong>excess temperatures <strong>in</strong> the two simulations, with and without<strong>cool<strong>in</strong>g</strong> respectively after one year <strong>of</strong> operation. If the housetemperature is 19° C (66° F) when 18° C (64° F) is required, thereis an excess temperature <strong>of</strong> 1° C (2° F). In the simulations, the<strong>cool<strong>in</strong>g</strong> is assumed active at an excess temperature <strong>of</strong> 0.3°C (0.54° F), 2° C (3.6° F) and 4° C (7.2° F). At these excess temperatures,it is possible to have 100% <strong>cool<strong>in</strong>g</strong> unlike <strong>in</strong> practisewhere the p-band is typically 2° C (3.6° F).<strong>The</strong> light green and lower curve <strong>of</strong> the figures symbolizes thetemperature <strong>in</strong>side the <strong>pig</strong> house if <strong>cool<strong>in</strong>g</strong> is <strong>in</strong>stalled. <strong>The</strong> uppercurve symbolizes the temperature, if <strong>cool<strong>in</strong>g</strong> is not <strong>in</strong>stalled.Based on the above graphs, it can be concluded:• <strong>The</strong> house temperature is <strong>high</strong>er than required approx. 800hours/year if <strong>cool<strong>in</strong>g</strong> is not <strong>in</strong>stalled. (Fig. 1-3). <strong>The</strong> number <strong>of</strong>° C hours* with excess temperature is approx. 2000° Ch (3600°Fh).• With <strong>cool<strong>in</strong>g</strong>, it is theoretically possible to reduce this to approx.150 hours/year and 500° C hours (900° F hours). (Fig. 1)• If the <strong>cool<strong>in</strong>g</strong> - for practical reasons or due to the automaticcontrol - is not activated until the excess temperature is 2°C (3.6° F), approx. 1200° C hours (2160° F hours) with excesstemperature are expected. (Fig. 2)• If the <strong>cool<strong>in</strong>g</strong> is not activated until the excess temperature is4° C (7.2° F), approx. 1900° C hours (3420° F hours) with excesstemperature are expected. (Fig. 3)* ° C hours: ° C hour (° F hours) reflects a too <strong>high</strong> temperature over a period <strong>of</strong> time. One hour with 2° C (3.6° F) excess temperature results <strong>in</strong> two ° C hours (3.6° F hours), two hourswith 3° C (5.4° F) result <strong>in</strong> six ° C hours (10.8° F hours) etc.