Lab #6 (Acceleration Due to Gravity)
Lab #6 (Acceleration Due to Gravity)
Lab #6 (Acceleration Due to Gravity)
Create successful ePaper yourself
Turn your PDF publications into a flip-book with our unique Google optimized e-Paper software.
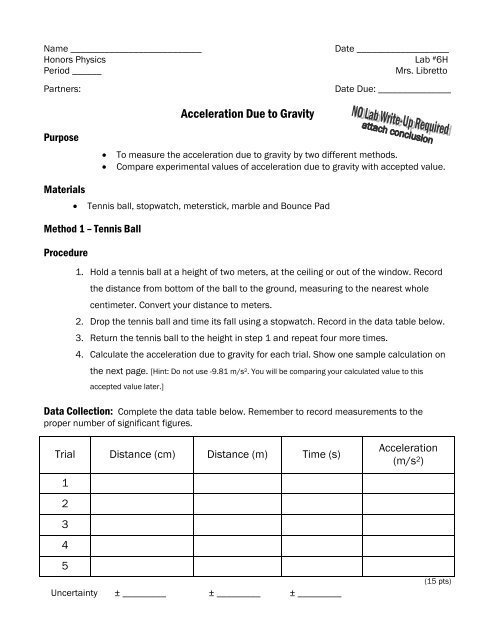
Name ___________________________Honors PhysicsPeriod ______Partners:Date ___________________<strong>Lab</strong> # 6HMrs. Libret<strong>to</strong>Date <strong>Due</strong>: _______________<strong>Acceleration</strong> <strong>Due</strong> <strong>to</strong> <strong>Gravity</strong>Purpose• To measure the acceleration due <strong>to</strong> gravity by two different methods.• Compare experimental values of acceleration due <strong>to</strong> gravity with accepted value.Materials• Tennis ball, s<strong>to</strong>pwatch, meterstick, marble and Bounce PadMethod 1 – Tennis BallProcedure1. Hold a tennis ball at a height of two meters, at the ceiling or out of the window. Recordthe distance from bot<strong>to</strong>m of the ball <strong>to</strong> the ground, measuring <strong>to</strong> the nearest wholecentimeter. Convert your distance <strong>to</strong> meters.2. Drop the tennis ball and time its fall using a s<strong>to</strong>pwatch. Record in the data table below.3. Return the tennis ball <strong>to</strong> the height in step 1 and repeat four more times.4. Calculate the acceleration due <strong>to</strong> gravity for each trial. Show one sample calculation onthe next page. [Hint: Do not use -9.81 m/s 2 . You will be comparing your calculated value <strong>to</strong> thisaccepted value later.]Data Collection: Complete the data table below. Remember <strong>to</strong> record measurements <strong>to</strong> theproper number of significant figures.Trial Distance (cm) Distance (m) Time (s)<strong>Acceleration</strong>(m/s 2 )12345Uncertainty ± _________ ± _________ ± _________1(15 pts)
Data Processing: Calculate the acceleration of the ball due <strong>to</strong> gravity for each trial. Show a singlesample calculation below and then summarize all your results neatly in the data tables.Method 1 (Trial 1):(10 pts)Givens and Unknowns: Equation: Substitution: Solution:d =t =vi = 0 m/sa = ?* After you calculate the acceleration for each trial, calculate the range, average and uncertainty in the average for theacceleration below.(10 pts)Range = ____________ Average = ________________ Uncertainty = _______________Experimental Value for <strong>Acceleration</strong> due <strong>to</strong> <strong>Gravity</strong> = ____________ ± __________ m/s 2Method 2 – Bounce PadProcedure1. Hold the marble in the clamp at the <strong>to</strong>p of the bounce pad. Record the distance from thebot<strong>to</strong>m of the marble <strong>to</strong> the <strong>to</strong>p of the bounce pad, measuring <strong>to</strong> the nearest tenth of acentimeter. Convert your distance <strong>to</strong> meters.2. Release the marble. The bounce pad will measure the time it <strong>to</strong>ok <strong>to</strong> fall. Record thismeasurement in the data table below. [Do not round off the measurement, keep all digits.]3. Return the marble <strong>to</strong> the clamp and repeat four more times. Do not move the clampheight between trials.5. Calculate the acceleration due <strong>to</strong> gravity for each trial. Show one sample calculation onthe next page. [Hint: Do not use -9.81 m/s 2 . You will be comparing your calculated value <strong>to</strong> thisaccepted value later.]2
Data Collection: Complete the data table below. Remember <strong>to</strong> record measurements <strong>to</strong> theproper number of significant figures.Trial Distance (cm) Distance (m) Time (s)<strong>Acceleration</strong>(m/s 2 )12345Uncertainty ± _________ ± _________ ± _________(15 pts)Data Processing: Calculate the acceleration of the ball due <strong>to</strong> gravity for each trial. Show a singlesample calculation below and then summarize all your results neatly in the data tables.Method 1 (Trial 1):(10 pts)Givens and Unknowns: Equation: Substitution: Solution:d =t =vi = 0 m/sa = ?* After you calculate the acceleration for each trial, calculate the range, average and uncertainty in the average for theacceleration below.(10 pts)Range = ____________ Average = ________________ Uncertainty = _______________Experimental Value for <strong>Acceleration</strong> due <strong>to</strong> <strong>Gravity</strong> = ____________ ± __________ m/s 23
Percent Error (10 pts)Calculate a percent error between your experimental value and the accepted value of 9.81 m/s 2 forboth methods. Show all of your work using the GUESS method.Method 1:Method 2:Conclusion (20 pts)• Using full, complete English sentences, type a conclusion which relates <strong>to</strong> the purpose of thislab. Your conclusion should be written in paragraphs, following the format below. Attach it <strong>to</strong>this lab.o Paragraph One• Restate the purpose of this lab.• State your experimental value for acceleration due <strong>to</strong> gravity from method 1. State yourpercent error for method 1.• State your experimental value for acceleration due <strong>to</strong> gravity from method 2. State yourpercent error for method 2.• Discuss which method was more accurate. Support your answer using the definition andyour results.• Discuss which method was more precise. Support your answer using the definition andyour results.o Paragraph Two• Write about one idea that was reinforced during the lab or one new concept you learned.o Paragraph Three• State one source of error in the experiment that likely occurred during your group’s datacollection. Then explain how the error occurred. Also, explain how that error affected youroverall results, such as increasing or decreasing your measurements/results/etc.• Do not say “human error.” If something was the result of you being a human andnot being perfect, explain exactly what occurred. Blaming your calculations,faulty equipment, lack of technology or imprecise <strong>to</strong>ols is also not acceptable.Really think about the data collection portion of the lab and things that may haveinfluenced it, avoid highly improbable events, such as wind gusts or dramaticallyshifting gravitational fields.• Be as specific as possible – explain if it increased or decreased – use descriptivewords such as minor, considerable, or drastically.• State and explain a second source of error in the experiment that likely occurred duringyour group’s data collection. This error should be completely unrelated <strong>to</strong> the first error.4


