22 Distribution and frequency of Culex pipiens and Culex torrentium ...
22 Distribution and frequency of Culex pipiens and Culex torrentium ...
22 Distribution and frequency of Culex pipiens and Culex torrentium ...

Create successful ePaper yourself
Turn your PDF publications into a flip-book with our unique Google optimized e-Paper software.
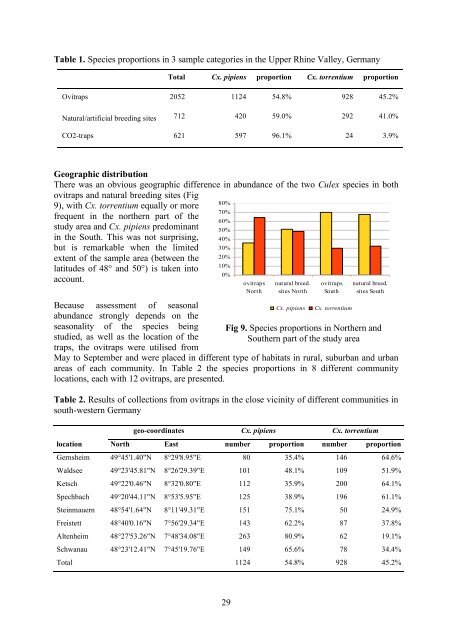
Table 1. Species proportions in 3 sample categories in the Upper Rhine Valley, GermanyTotal Cx. <strong>pipiens</strong> proportion Cx. <strong>torrentium</strong> proportionOvitraps 2052 1124 54.8% 928 45.2%Natural/artificial breeding sites 712 420 59.0% 292 41.0%CO2-traps 621 597 96.1% 24 3.9%Geographic distributionThere was an obvious geographic difference in abundance <strong>of</strong> the two <strong>Culex</strong> species in bothovitraps <strong>and</strong> natural breeding sites (Fig9), with Cx. <strong>torrentium</strong> equally or morefrequent in the northern part <strong>of</strong> thestudy area <strong>and</strong> Cx. <strong>pipiens</strong> predominantin the South. This was not surprising,but is remarkable when the limitedextent <strong>of</strong> the sample area (between thelatitudes <strong>of</strong> 48° <strong>and</strong> 50°) is taken intoaccount.Because assessment <strong>of</strong> seasonalabundance strongly depends on theseasonality <strong>of</strong> the species beingstudied, as well as the location <strong>of</strong> thetraps, the ovitraps were utilised from80%70%60%50%40%30%20%10%0%ovitrapsNorthnatural breed.sites NorthCx. <strong>pipiens</strong>ovitrapsSouthCx. <strong>torrentium</strong>natural breed.sites SouthFig 9. Species proportions in Northern <strong>and</strong>Southern part <strong>of</strong> the study areaMay to September <strong>and</strong> were placed in different type <strong>of</strong> habitats in rural, suburban <strong>and</strong> urbanareas <strong>of</strong> each community. In Table 2 the species proportions in 8 different communitylocations, each with 12 ovitraps, are presented.Table 2. Results <strong>of</strong> collections from ovitraps in the close vicinity <strong>of</strong> different communities insouth-western Germanygeo-coordinates Cx. <strong>pipiens</strong> Cx. <strong>torrentium</strong>location North East number proportion number proportionGernsheim 49°45'1.40"N 8°29'8.95"E 80 35.4% 146 64.6%Waldsee 49°23'45.81"N 8°26'29.39"E 101 48.1% 109 51.9%Ketsch 49°<strong>22</strong>'0.46"N 8°32'0.80"E 112 35.9% 200 64.1%Spechbach 49°20'44.11"N 8°53'5.95"E 125 38.9% 196 61.1%Steinmauern 48°54'1.64"N 8°11'49.31"E 151 75.1% 50 24.9%Freistett 48°40'0.16"N 7°56'29.34"E 143 62.2% 87 37.8%Altenheim 48°27'53.26"N 7°48'34.08"E 263 80.9% 62 19.1%Schwanau 48°23'12.41"N 7°45'19.76"E 149 65.6% 78 34.4%Total 1124 54.8% 928 45.2%29