Printable article - Evidence from the AD 2000 Izu Islands swarm that ...
Printable article - Evidence from the AD 2000 Izu Islands swarm that ...
Printable article - Evidence from the AD 2000 Izu Islands swarm that ...
- No tags were found...

Create successful ePaper yourself
Turn your PDF publications into a flip-book with our unique Google optimized e-Paper software.
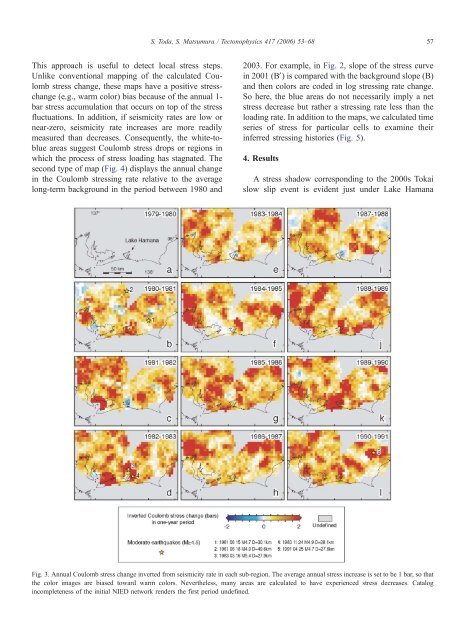
S. Toda, S. Matsumura / Tectonophysics 417 (2006) 53–68 57This approach is useful to detect local stress steps.Unlike conventional mapping of <strong>the</strong> calculated Coulombstress change, <strong>the</strong>se maps have a positive stresschange(e.g., warm color) bias because of <strong>the</strong> annual 1-bar stress accumulation <strong>that</strong> occurs on top of <strong>the</strong> stressfluctuations. In addition, if seismicity rates are low ornear-zero, seismicity rate increases are more readilymeasured than decreases. Consequently, <strong>the</strong> white-toblueareas suggest Coulomb stress drops or regions inwhich <strong>the</strong> process of stress loading has stagnated. Thesecond type of map (Fig. 4) displays <strong>the</strong> annual changein <strong>the</strong> Coulomb stressing rate relative to <strong>the</strong> averagelong-term background in <strong>the</strong> period between 1980 and2003. For example, in Fig. 2, slope of <strong>the</strong> stress curvein 2001 (BV) is compared with <strong>the</strong> background slope (B)and <strong>the</strong>n colors are coded in log stressing rate change.So here, <strong>the</strong> blue areas do not necessarily imply a netstress decrease but ra<strong>the</strong>r a stressing rate less than <strong>the</strong>loading rate. In addition to <strong>the</strong> maps, we calculated timeseries of stress for particular cells to examine <strong>the</strong>irinferred stressing histories (Fig. 5).4. ResultsA stress shadow corresponding to <strong>the</strong> <strong>2000</strong>s Tokaislow slip event is evident just under Lake HamanaFig. 3. Annual Coulomb stress change inverted <strong>from</strong> seismicity rate in each sub-region. The average annual stress increase is set to be 1 bar, so <strong>that</strong><strong>the</strong> color images are biased toward warm colors. Never<strong>the</strong>less, many areas are calculated to have experienced stress decreases. Catalogincompleteness of <strong>the</strong> initial NIED network renders <strong>the</strong> first period undefined.