

jll-business-of-cities-report
jll-business-of-cities-report
jll-business-of-cities-report

You also want an ePaper? Increase the reach of your titles
YUMPU automatically turns print PDFs into web optimized ePapers that Google loves.
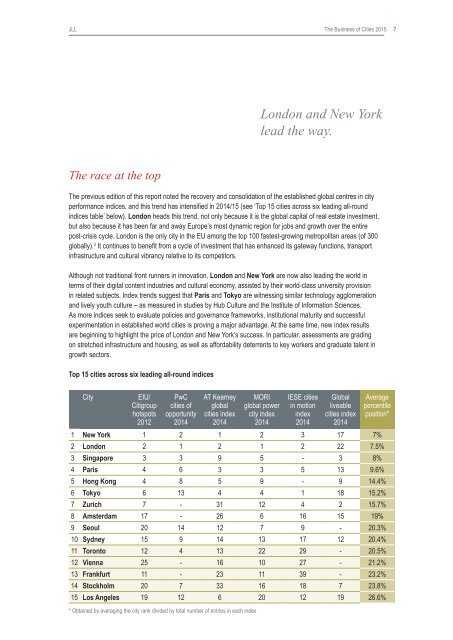
JLLThe Business <strong>of</strong> Cities 2015 7London and New Yorklead the way.The race at the topThe previous edition <strong>of</strong> this <strong>report</strong> noted the recovery and consolidation <strong>of</strong> the established global centres in cityperformance indices, and this trend has intensified in 2014/15 (see ‘Top 15 <strong>cities</strong> across six leading all-roundindices table’ below). London heads this trend, not only because it is the global capital <strong>of</strong> real estate investment,but also because it has been far and away Europe’s most dynamic region for jobs and growth over the entirepost-crisis cycle. London is the only city in the EU among the top 100 fastest-growing metropolitan areas (<strong>of</strong> 300globally). 3 It continues to benefit from a cycle <strong>of</strong> investment that has enhanced its gateway functions, transportinfrastructure and cultural vibrancy relative to its competitors.Although not traditional front runners in innovation, London and New York are now also leading the world interms <strong>of</strong> their digital content industries and cultural economy, assisted by their world-class university provisionin related subjects. Index trends suggest that Paris and Tokyo are witnessing similar technology agglomerationand lively youth culture – as measured in studies by Hub Culture and the Institute <strong>of</strong> Information Sciences.As more indices seek to evaluate policies and governance frameworks, institutional maturity and successfulexperimentation in established world <strong>cities</strong> is proving a major advantage. At the same time, new index resultsare beginning to highlight the price <strong>of</strong> London and New York’s success. In particular, assessments are gradingon stretched infrastructure and housing, as well as affordability deterrents to key workers and graduate talent ingrowth sectors.Top 15 <strong>cities</strong> across six leading all-round indicesCityEIU/Citigrouphotspots2012PwC<strong>cities</strong> <strong>of</strong>opportunity2014AT Kearneyglobal<strong>cities</strong> index2014MORIglobal powercity index2014IESE <strong>cities</strong>in motionindex2014Globalliveable<strong>cities</strong> index2014Averagepercentileposition*1 New York 1 2 1 2 3 17 7%2 London 2 1 2 1 2 22 7.5%3 Singapore 3 3 9 5 - 3 8%4 Paris 4 6 3 3 5 13 9.6%5 Hong Kong 4 8 5 9 - 9 14.4%6 Tokyo 6 13 4 4 1 18 15.2%7 Zurich 7 - 31 12 4 2 15.7%8 Amsterdam 17 - 26 6 16 15 19%9 Seoul 20 14 12 7 9 - 20.3%10 Sydney 15 9 14 13 17 12 20.4%11 Toronto 12 4 13 22 29 - 20.5%12 Vienna 25 - 16 10 27 - 21.2%13 Frankfurt 11 - 23 11 39 - 23.2%14 Stockholm 20 7 33 16 18 7 23.8%15 Los Angeles 19 12 6 20 12 19 26.6%* Obtained by averaging the city rank divided by total number <strong>of</strong> entries in each index