Operations and Financial Review - Mewah Group
Operations and Financial Review - Mewah Group
Operations and Financial Review - Mewah Group

You also want an ePaper? Increase the reach of your titles
YUMPU automatically turns print PDFs into web optimized ePapers that Google loves.
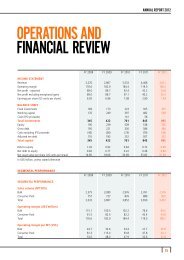
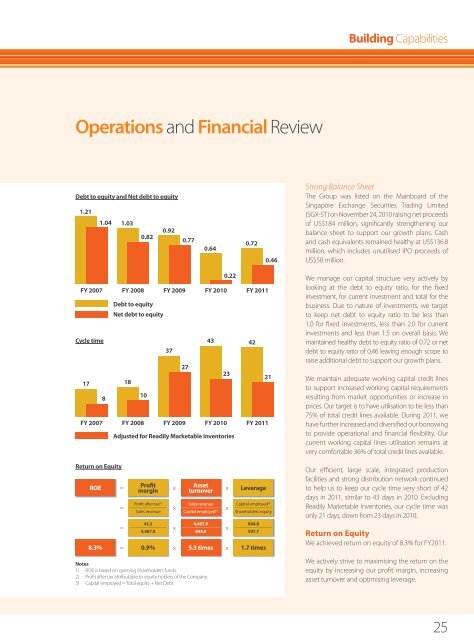
Building Capabilities<strong>Operations</strong> <strong>and</strong> <strong>Financial</strong> <strong>Review</strong>Debt to equity <strong>and</strong> Net debt to equity1.211.04 1.030.920.820.770.640.720.46Strong Balance SheetThe <strong>Group</strong> was listed on the Mainboard of the (SGX-ST) on November 24, 2010 raising net proceedsof US$184 million, significantly strengthening ourbalance sheet to support our growth plans. Cash<strong>and</strong> cash equivalents remained healthy at US$136.8million, which includes unutilised IPO proceeds ofUS$58 million.FY 2007 FY 2008 FY 2009 FY 2010 FY 2011Cycle time17FY 2007Return on EquityROE8Debt to equityNet debt to equity1810FY 2008Adjusted for Readily Marketable InventoriesProfitmarginProfit after tax (2)_________________Sales revenue42.2_________________4,467.937FY 2009AssetturnoverSales revenue_________________Capital employed (3)4,467.9_________________844.8Notes1) ROE is based on opening Shareholders funds.2) Profit after tax attributable to equity holders of the Company.3) Capital employed = Total equity + Net DebtFY 2010LeverageCapital employed (3)_________________Shareholders’ equity844.8_________________507.78.3% 0.9% 5.3 times1.7 times27430.22234221FY 2011We manage our capital structure very actively bylooking at the debt to equity ratio, for the fixedinvestment, for current investment <strong>and</strong> total for thebusiness. Due to nature of investments, we targetto keep net debt to equity ratio to be less than1.0 for fixed investments, less than 2.0 for currentinvestments <strong>and</strong> less than 1.5 on overall basis. Wemaintained healthy debt to equity ratio of 0.72 or netdebt to equity ratio of 0.46 leaving enough scope toraise additional debt to support our growth plans.We maintain adequate working capital credit linesto support increased working capital requirementsresulting from market opportunities or increase inprices. Our target is to have utilisation to be less than75% of total credit lines available. During 2011, wehave further increased <strong>and</strong> diversified our borrowingto provide operational <strong>and</strong> financial flexibility. Ourcurrent working capital lines utilisation remains atvery comfortable 36% of total credit lines available.Our efficient, large scale, integrated productionfacilities <strong>and</strong> strong distribution network continuedto help us to keep our cycle time very short of 42days in 2011, similar to 43 days in 2010. ExcludingReadily Marketable Inventories, our cycle time wasonly 21 days, down from 23 days in 2010.Return on EquityWe achieved return on equity of 8.3% for FY2011.We actively strive to maximising the return on theequity by increasing our profit margin, increasingasset turnover <strong>and</strong> optimising leverage.25