Runoff generation mechanisms
Runoff generation mechanisms
Runoff generation mechanisms

You also want an ePaper? Increase the reach of your titles
YUMPU automatically turns print PDFs into web optimized ePapers that Google loves.
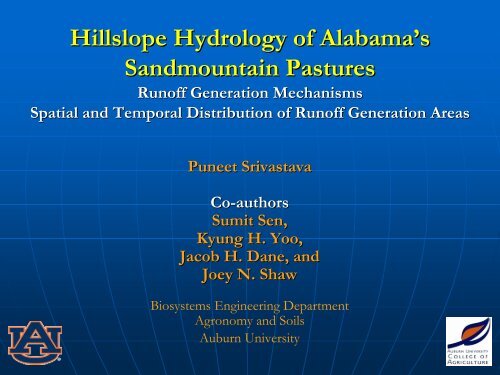
Hillslope Hydrology of Alabama’sSandmountain Pastures<strong>Runoff</strong> Generation MechanismsSpatial and Temporal Distribution of <strong>Runoff</strong> Generation AreasPuneet SrivastavaCo-authorsSumit Sen,Kyung H. Yoo,Jacob H. Dane, andJoey N. ShawBiosystems Engineering DepartmentAgronomy and SoilsAuburn University
Presentation Outline• Justification• <strong>Runoff</strong> Generation Process Concepts• Objectives• Methodology - Instrumentation• Results and Discussion• <strong>Runoff</strong> <strong>generation</strong> <strong>mechanisms</strong>• Spatial and temporal variability of runoff <strong>generation</strong> areas• Conclusions/Implications of P transport
Justification• Alabama ranks in top three in broilerproduction• About 500 CAFOs and 4000 AFOs;about 12,000 chicken houses• Broiler litter production – 1.8 milliontons/year• Most of the poultry productionoccurs in 5 counties in theAppalachian Plateau (Sandmountainregion)• Land application to pastures - buildup and transport of PTennessee Valley Phosphorusin poultrylitter as apercent ofAppalachian Plateau crop needsin AlabamacountiesBlack Belt soil region0-50%50-100%100-150%150+%
Alabama P-IndexP• Alabama P-Index: Palleviate water quality issues related to Ploss• Based on the principle that P is transported in surface runoff• Agronomic soil P thresholds• <strong>Runoff</strong> class (hydrologic soil groups)• Soil erosion• P application distance to water• Treats an entire field as runoff (and P) contributing area• Recent studies indicate subsurface transport might beimportant• <strong>Runoff</strong> might not occur uniformly (spatial and temporally) onthe entire hillslope
<strong>Runoff</strong> Generation ProcessesInfiltration excess overland flowaka Horton overland flowPPfPfPartial area infiltration excess overland flowPPPfSaturation excess overland flowPPP
<strong>Runoff</strong> Generation ProcessesSubsurface stormflowPPPPerched subsurface stormflowPPPHorizon 1Horizon 2
<strong>Runoff</strong> Generation Processes• Factors affecting runoff <strong>generation</strong> in watershed:• Rainfall characteristics• Soil hydraulic characteristics• Antecedent moisture conditions• Topography• Vegetation• Depth to water table• Presence or absence of restrictive layers (fragipans(fragipans)• Depending on the runoff <strong>generation</strong> process• Over or underestimation of runoff and P transportpotential• Inappropriate application of BMPs
Objectives• Identify the main surface runoff <strong>generation</strong> mechanism inthe Sandmountain region of Alabama• Identify spatial and temporal distribution of hydrologicallyactive areas (HAAs) and their connectivity to the outlet
• A pasture hillslope of 0.12 hawas instrumented atSandmountain Research andExtension Center, Crossville,AL• Located in DeKalb County,one of largest poultryproducing counties in AL• Detailed topography• Surface and subsurfacesensorsStudy Site
Study Site
Surface <strong>Runoff</strong> Sensor• Surface sensors work on“Yes” or “No”
Subsurface <strong>Runoff</strong> SensorWaterlevel incmVoltage(V)0 2.254 2.009 1.7020 1.5027 1.0040 0.52GroundPin0
Instrumentation
Results and Discussion<strong>Runoff</strong> Generation MechanismJune 23, 2006High_intensityshort durationSep 7, 2006Medium_intensitymedium durationOct 27, 2006Low_intensitylong duration
Results and Discussion<strong>Runoff</strong> Generation MechanismDisk infiltrometer(Decagon, Inc.)Low (0 – 5.0 mm/hr)Medium (5.1 – 20.0 mm/hr)High ( > 20.1 mm/hr)
Results and Discussion<strong>Runoff</strong> Generation MechanismR a in fa ll (m m/hr)9080706050403020100151015201530154015501600Time (hh:mm)High intensityshort-durationSummer Precipitation16101620163016401650
Results and Discussion<strong>Runoff</strong> Generation Mechanism• Location 4 (measured soil hydraulic conductivity 11.1 mm/hr)321!( 12!(3 4!( !(320.55 6!( !(7!(8!(0.1 m Contours3209!(10!(11!(Hillslope Drainage BoundaryHydraulic Conductivity!( High!( Medium!( Low319.5!(12 13!(15!(14!(17!(1621!(!(20!(!(19 29!( !(2531!(18 28!( !( 23 !(!( 30!(24!(319318.50 3.75 7.5 15 22.5 30¸26!(318.1Meters27!(Time(hhmm)IncrementalRainfall(mm)RainfallIntensity(mm/hr)SubsurfaceSensor - Depthto water table(cm)Surface Sensor -<strong>Runoff</strong>Occurrence(yes/no)1510 2.54 30.5 42 Yes1520 5.33 64.0 40 Yes1530 1.52 18.3 40 Yes1540 0.508 6.1 27 Yes1550 0.00 0.0 40 YesInterpretationInfiltration excessrunoffInfiltration excessrunoffInfiltration excessrunoffInfiltration excessrunoffInfiltration excessrunoff
Results and Discussion<strong>Runoff</strong> Generation Mechanism• Location 6 (measured soil hydraulic conductivity 51.2 cm/hr)321!( 12!(3 4!( !(320.55 6!( !(7!(8!(0.1 m Contours3209!(10!(11!(Hillslope Drainage BoundaryHydraulic Conductivity!( High!( Medium!( Low319.5!(12 13!(15!(14!(17!(1621!(!(20!(!(19 29!( !(2531!(18 28!( !( 23 !(!( 30!(24!(319318.50 3.75 7.5 15 22.5 30¸26!(318.1Meters27!(Time(hhmm)IncrementalRainfall(mm)RainfallIntensity(mm/hr)SubsurfaceSensor - Depthto water table(cm)Surface Sensor -<strong>Runoff</strong>Occurrence(yes/no)1510 2.54 30.5 42 Yes1520 5.33 64.0 4 Yes1530 1.52 18.3 4 Yes1540 0.508 6.1 4 Yes1550 0.00 0.0 4 YesInterpretationInfiltration excessrunoffInfiltration excessrunoffInfiltration excessrunoffInfiltration excessrunoffInfiltration excessrunoff
Results and Discussion<strong>Runoff</strong> Generation Mechanism• Location 16 (measured soil hydraulic conductivity 3.5 mm/hr)321!( 12!(3 4!( !(320.55 6!( !(7!(8!(0.1 m Contours3209!(10!(11!(Hillslope Drainage BoundaryHydraulic Conductivity!( High!( Medium!( Low319.5!(12 13!(15!(14!(17!(1621!(!(20!(!(19 29!( !(2531!(18 28!( !( 23 !(!( 30!(24!(319318.50 3.75 7.5 15 22.5 30¸26!(318.1Meters27!(Time(hhmm)IncrementalRainfall(mm)RainfallIntensity(mm/hr)SubsurfaceSensor - Depthto water table(cm)Surface Sensor -<strong>Runoff</strong>Occurrence(yes/no)1510 2.54 30.5 42 Yes1520 5.33 64.0 4 Yes1530 1.52 18.3 4 Yes1540 0.508 6.1 4 Yes1550 0.00 0.0 4 YesInterpretationInfiltration excessrunoffInfiltration excessrunoffInfiltration excessrunoffInfiltration excessrunoffInfiltration excessrunoff
Results and Discussion<strong>Runoff</strong> Generation Mechanism• Location 26 (measured soil hydraulic conductivity 0.7 mm/hr)321!( 12!(3 4!( !(320.55 6!( !(7!(8!(0.1 m Contours3209!(10!(11!(Hillslope Drainage BoundaryHydraulic Conductivity!( High!( Medium!( Low319.5!(12 13!(15!(14!(17!(1621!(!(20!(!(19 29!( !(2531!(18 28!( !( 23 !(!( 30!(24!(319318.50 3.75 7.5 15 22.5 30¸26!(318.1Meters27!(Time(hhmm)IncrementalRainfall(mm)RainfallIntensity(mm/hr)SubsurfaceSensor - Depthto water table(cm)Surface Sensor -<strong>Runoff</strong>Occurrence(yes/no)1510 2.54 30.5 42 Yes1520 5.33 64.0 27 Yes1530 1.52 18.3 27 Yes1540 0.508 6.1 40 Yes1550 0.00 0.0 40 YesInterpretationInfiltration excessrunoffInfiltration excessrunoffInfiltration excessrunoffInfiltration excessrunoffInfiltration excessrunoff
Results and Discussion<strong>Runoff</strong> Generation MechanismR ainfall (m m /hr)20181614121086420161516301645170017151730Medium intensitymedium-durationFall Precipitation1745Time (hh:mm)180018151830184519001915Sen, S., P. Srivastava, K. Yoo, J. Dane, J. Shaw, andM.S. Kang. 2008. RUNOFF GENERATIONMECHANISMS IN PASTURES OF THE SANDMOUNTAIN REGION OF ALABAMA – A FIELDINVESTIGATION. Hydrological Processes (In Press)R ain fall (m m /h r)Similar analyses for Sep 7, 2006 (medium intensity,medium-duration) and October 22, 2006 (lowintensity, long-duration)76543210Low intensitylong-durationWinter Precipitation2053104155206257308359401045115012551400150516101730183519402045Time (hh:mm)
Results and DiscussionSpatial and Temporal Distribution and ConnectivityRainfall (mm/hr)908070605040302010015101520153015401550June 23, 2006 Event16001610Time (hh:mm)1620163016401650Discharge (m 3 /min)8.0E+007.0E+006.0E+005.0E+004.0E+003.0E+002.0E+001.0E+000.0E+001510154016101640171017401810184019101940Time (HH:MM)2010204021102140100% of the total areawas contributingsurface runoff29% of the total areawas contributingsurface runoff
Results and DiscussionSpatial and Temporal Distribution and ConnectivityRainfall (mm/hr)6050403020100July 20, 2007 EventDischarge( m 3 /m in)4.0E-023.5E-023.0E-022.5E-022.0E-021.5E-021.0E-025.0E-030.0E+0010401050110011101120113011401150120012101220123012401250104010501100111011201130114011501200121012201230Time (hh:mm)Time (hh:mm)49% of the total areawas contributingsurface runoff100% of the total areawas contributingsurface runoff
Results and DiscussionSpatial and Temporal Distribution and ConnectivityRainfall (mm/hr)6050403020100Discharge( m 3 /m in)4.0E-023.5E-023.0E-022.5E-022.0E-021.5E-021.0E-025.0E-030.0E+0010401050110011101120113011401150120012101220123012401250104010501100111011201130114011501200121012201230Time (hh:mm)Time (hh:mm)73% of the total areawas contributingsurface runoff41% of the total areawas contributingsurface runoff
Results and DiscussionSpatial and Temporal Distribution and ConnectivitySen, S., P. Srivastava, K. Yoo, J. Dane, J. Shaw, and M.S. Kang. 2008. SPATIAL AND TEMPORAL DYNAMICS ANDCONNECTIVITY OF RUNOFF CONTRIBUTING AREAS IN PASTURES OF THE SANDMOUNTAIN REGION OFALABAMA – A FIELD INVESTIGATION. Hydrological Processes (In preparation)
Conclusions• Surface runoff <strong>generation</strong> mechanism was mostly infiltrationexcess in the Sandmountain pasture of Alabama.• Rainfall intensity and soil hydraulic conductivity controlsurface runoff <strong>generation</strong>.• At times (when the rainfall intensity is high), surface runoffcan be generated from the entire hillslope.• Connected areas of low soil hydraulic conductivitycontribute most of the surface runoff at the outlet.• Overall, preliminary analysis shows that during high-intensity short and medium duration rainfalls no more than10% of the rainfall results in surface runoff at the outlet.• For medium-intensity, intensity, long duration rainfalls no more than5% of the rainfall results in surface runoff
Implications and Future Work• Since surface runoff contributions to the outlet is small –significant infiltration occurs, highlighting the importance ofunderstanding subsurface flows and subsurface transport.Subsurface stormflowPPPPerched subsurface stormflowPPPHorizon 1Horizon 2
Implications and Future Work• Quantification of surface and subsurface flows through 2-D 2modeling• Quantification of leaching of P from surface and subsurfaceapplied broiler litter – Field investigation• New and improved BMPs that take into account the major Ptransport pathway is needed.• Alabama P-index Pmight need to be revised.