Farming System Approach to Improve IUE, Employment and Income ...
Farming System Approach to Improve IUE, Employment and Income ...
Farming System Approach to Improve IUE, Employment and Income ...

You also want an ePaper? Increase the reach of your titles
YUMPU automatically turns print PDFs into web optimized ePapers that Google loves.
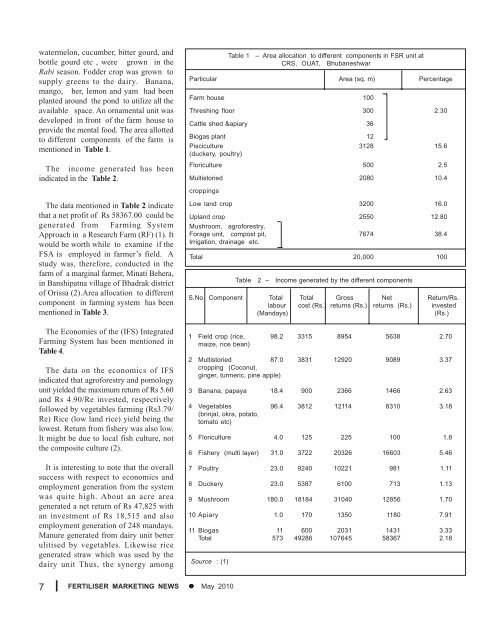
watermelon, cucumber, bitter gourd, <strong>and</strong>bottle gourd etc , were grown in theRabi season. Fodder crop was grown <strong>to</strong>supply greens <strong>to</strong> the dairy. Banana,mango, ber, lemon <strong>and</strong> yam had beenplanted around the pond <strong>to</strong> utilize all theavailable space. An ornamental unit wasdeveloped in front of the farm house <strong>to</strong>provide the mental food. The area allotted<strong>to</strong> different components of the farm ismentioned in Table 1.The income generated has beenindicated in the Table 2.The data mentioned in Table 2 indicatethat a net profit of Rs 58367.00 could begenerated from <strong>Farming</strong> <strong>System</strong><strong>Approach</strong> in a Research Farm (RF) (1). Itwould be worth while <strong>to</strong> examine if theFSA is employed in farmer’s field. Astudy was, therefore, conducted in thefarm of a marginal farmer, Minati Behera,in Banshipatna village of Bhadrak distric<strong>to</strong>f Orissa (2).Area allocation <strong>to</strong> differentcomponent in farming system has beenmentioned in Table 3.The Economies of the (IFS) Integrated<strong>Farming</strong> <strong>System</strong> has been mentioned inTable 4.The data on the economics of IFSindicated that agroforestry <strong>and</strong> pomologyunit yielded the maximum return of Rs 5.60<strong>and</strong> Rs 4.90/Re invested, respectivelyfollowed by vegetables farming (Rs3.79/Re) Rice (low l<strong>and</strong> rice) yield being thelowest. Return from fishery was also low.It might be due <strong>to</strong> local fish culture, notthe composite culture (2).It is interesting <strong>to</strong> note that the overallsuccess with respect <strong>to</strong> economics <strong>and</strong>employment generation from the systemwas quite high. About an acre areagenerated a net return of Rs 47,825 withan investment of Rs 18,515 <strong>and</strong> alsoemployment generation of 248 m<strong>and</strong>ays.Manure generated from dairy unit betterulitised by vegetables. Likewise ricegenerated straw which was used by thedairy unit Thus, the synergy amongTable 1 – Area allocation <strong>to</strong> different components in FSR unit atCRS, OUAT, BhubaneshwarParticular Area (sq. m) PercentageFarm house 100Threshing floor 300 2.30Cattle shed &apiary 36Biogas plant 12Pisciculture 3128 15.6(duckery, poultry)Floriculture 500 2.5Multis<strong>to</strong>ried 2080 10.4croppingsLow l<strong>and</strong> crop 3200 16.0Upl<strong>and</strong> crop 2550 12.80Mushroom, agroforestry,Forage unit, compost pit, 7674 38.4Irrigation, drainage etc.Total 20,000 100Table 2 – <strong>Income</strong> generated by the different componentsS.No Component Total Total Gross Net Return/Rs.labour cost (Rs.) returns (Rs.) returns (Rs.) invested(M<strong>and</strong>ays)(Rs.)1 Field crop (rice, 98.2 3315 8954 5638 2.70maize, rice bean)2 Multis<strong>to</strong>ried 87.0 3831 12920 9089 3.37cropping (Coconut,ginger, turmeric, pine apple)3 Banana, papaya 18.4 900 2366 1466 2.634 Vegetables 96.4 3812 12114 8310 3.18(brinjal, okra, pota<strong>to</strong>,<strong>to</strong>ma<strong>to</strong> etc)5 Floriculture 4.0 125 225 100 1.86 Fishery (multi layer) 31.0 3722 20326 16603 5.467 Poultry 23.0 9240 10221 981 1.118 Duckery 23.0 5387 6100 713 1.139 Mushroom 180.0 18184 31040 12856 1.7010 Apiary 1.0 170 1350 1180 7.9111 Biogas 11 600 2031 1431 3.33Total 573 49286 107645 58367 2.18Source : (1)7FERTILISER MARKETING NEWS • May 2010