University Facts & Figures - Virginia Tech
University Facts & Figures - Virginia Tech
University Facts & Figures - Virginia Tech

You also want an ePaper? Increase the reach of your titles
YUMPU automatically turns print PDFs into web optimized ePapers that Google loves.
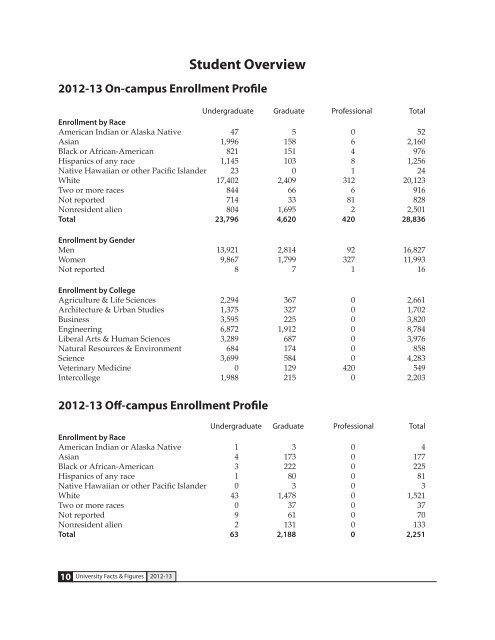
Student Overview2012-13 On-campus Enrollment ProfileUndergraduate Graduate Professional TotalEnrollment by RaceAmerican Indian or Alaska Native 47 5 0 52Asian 1,996 158 6 2,160Black or African-American 821 151 4 976Hispanics of any race 1,145 103 8 1,256Native Hawaiian or other Pacific Islander 23 0 1 24White 17,402 2,409 312 20,123Two or more races 844 66 6 916Not reported 714 33 81 828Nonresident alien 804 1,695 2 2,501Total 23,796 4,620 420 28,836Enrollment by GenderMen 13,921 2,814 92 16,827Women 9,867 1,799 327 11,993Not reported 8 7 1 16Enrollment by CollegeAgriculture & Life Sciences 2,294 367 0 2,661Architecture & Urban Studies 1,375 327 0 1,702Business 3,595 225 0 3,820Engineering 6,872 1,912 0 8,784Liberal Arts & Human Sciences 3,289 687 0 3,976Natural Resources & Environment 684 174 0 858Science 3,699 584 0 4,283Veterinary Medicine 0 129 420 549Intercollege 1,988 215 0 2,2032012-13 Off-campus Enrollment ProfileUndergraduate Graduate Professional TotalEnrollment by RaceAmerican Indian or Alaska Native 1 3 0 4Asian 4 173 0 177Black or African-American 3 222 0 225Hispanics of any race 1 80 0 81Native Hawaiian or other Pacific Islander 0 3 0 3White 43 1,478 0 1,521Two or more races 0 37 0 37Not reported 9 61 0 70Nonresident alien 2 131 0 133Total 63 2,188 0 2,25110<strong>University</strong> <strong>Facts</strong> & <strong>Figures</strong> 2012-13