Neurophysiology ArticleSingle Pulse Electrical Stimulation in Presurgical Assessment ofEpilepsy: A New Diagnostic ToolEpilepsy is a major source of disability amongst allage groups. Although most epilepsies are well controlledon antiepileptic drugs, around 20% ofpatients fail to gain medical control, and are potentialcandidates for surgery. However, despite recent technicaladvances, the overall success rate of surgery for epilepsyremains at about 75%.At the department of Clinical Neurophysiology atKing’s College Hospital, we have developed single pulseelectrical stimulation (SPES) as a method to identifyepileptogenic cortex in the human brain. Corticalresponses to SPES (1msec duration pulses, 4-8mA, 0.1-0.2Hz) were studied in 125 consecutive patients evaluatedwith intracranial electrodes as candidates for resectivesurgery for the treatment of their epilepsy.Two main groups of cortical responses were generatedby SPES: 1) early responses (ER), starting immediatelyafter the stimulus and considered as responses of normalcortex to stimulation; and 2) late responses (LR), corticalresponses seen in some areas after the initial ER. Two differenttypes of LR were seen: a) delayed responses (DR):responses resembling spikes or sharp waves occurringbetween 100 milliseconds and 1 second after stimulation;and b) repetitive responses (RR): two or more consecutivesharp-and-slow-wave complexes, each resembling the initialearly response. DR were seen when stimulating temporaland extratemporal structures and RR when stimulatingfrontal structures. Late responses to SPES are related toareas where spontaneous seizure onset occurs. They canidentify epileptogenic cortex and predict surgical outcome,especially when a frontal or temporal focus is suspected.Single-pulse electrical stimulation (SPES) could be animportant additional investigation during presurgicalassessment and can be particularly useful in patients whohave widespread or multiple epileptogenic areas, normalneuroimaging, or few seizures during telemetry.Table 1: Cross tabulation between type of late response and seizure onset.IntroductionEpilepsy is one of the most common neurological disorders,with a prevalence of 4-10/1000 and an incidence of50-70/100,000 per year. 1,2 About 20% of patients withepilepsy are not satisfactorily controlled by medical treatmentand are potential candidates for surgery.In focal epilepsies, there is a localised area of abnormalnervous tissue from which seizures originate (epileptogeniccortex). A successful outcome of resective epilepsysurgery depends on accurate identification of the epileptogeniccortex which is structurally and functionallyabnormal. Recent developments in medical imagingprovide powerful means to localise structural lesions.Identification of functional abnormalities still requireselectroencephalographic (EEG) recordings of seizureonset. Despite technical advances in surgical proceduresand presurgical assessment over recent decades, theoverall success rate of resective surgery of epilepsyremains at about 75% even in the best centres. 3 The reasonsfor a 25% failure rate are unclear, but might berelated to difficulties in identifying the area from whichthe seizures originate. Its location is inferred from clinical,imaging and electrophysiological findings.Sometimes seizure recordings with intracranial electrodesare necessary to identify epileptogenic cortex. Asthe number of intracranial electrodes implanted is necessarilylimited and seizures can rapidly propagatebetween regions, intracranial recordings can sometimesbe misleading in seizures arising from areas where noelectrodes were implanted.Since epilepsy is due to an imbalance between excitationand inhibition, an alternative is to map corticalexcitability in order to identify hyperexcitable areas thatcould be epileptogenic. This can in principle be achievedby recording EEG responses to electrical stimulation inpatients with intracranial recordings. Electrical stimulationwith trains of pulses at 50-60Hz is routinely used insome centres to map cortical function and after-dischargethreshold, and to elicit habitual seizures. However,it is difficult to study cortical excitability with such stimulationparameters because they are likely to producemassive and widespread cortical activation. In theDepartments of Clinical Neurophysiology andNeurosurgery at King’s College Hospital, we have developeda method to identify hyperexcitable cortex throughthe study of EEG responses to single pulse electrical stimulation(SPES). 4-6 In the present article we review theIctal Onset Zone typeDR/RR typeFocal Regional Diffuse Bilateral Indep. No sz TotalFocal DR 18 7 0 3 2 30Regional DR 6 33* 1 0 0 40Bilateral DR 4 4** 0 7 3*** 18Only RR 0 5 0 0 0 5No DR/RR 3 18 7 2 2 32Total 31 67 8 12 7 125Patients showing focal and regional ictal onset zones were considered as having regional ictal onset zone. Patients showing focal andregional DR were considered as having regional DR. The ictal onset zone was defined as the region where the initial ictal changes wereseen in intracranial recordings.* Two patients also had repetitive responses (RR).** One patient also had repetitive responses (RR).*** One patient had delayed and repetitive responses when stimulating both medial frontal regions.DR=Delayed Responses; Bilateral DR=independent DR seen on both hemispheres; RR=Repetitive Responses; Indep=independent;sz=seizures.Antonio Valentin, MD, PhD, is aClinical Lecturer in the Departmentof Clinical Neuroscience of theInstitute of Psychiatry at King’sCollege London and HonoraryClinical Fellow at the Departmentof Clinical Neurophysiology atKing’s College Hospital. Hisresearch interests are the developmentof new diagnosis and treatmenttechniques for Epilepsy andMovement Disorders. He qualifiedfrom the University Complutense(Madrid, Spain).Gonzalo Alarcón, MD, PhD, isSenior Lecturer in the Departmentof Clinical Neuroscience of theInstitute of Psychiatry andHonorary Consultant in ClinicalNeurophysiology at King’s CollegeHospital. His research interests arepresurgical assessment of epilepsyand the mechanisms involved inthe generation of human epilepticseizures. He qualified from theUniversity Complutense (Madrid,Spain).Correspondance to:Dr Antonio Valentin, MD, PhD,Department of Neuroscience,Institute of Psychiatry,King’s College London,London SE5 8AF, UK.Tel. +44 20 7848 5161Fax. +44 20 7346 3725Email. antonio.valentin@iop.kcl.ac.ukThe corresponding author hashad full access to all the data inthe study and has had finalresponsibility for the decision tosubmit the paper.14 I <strong>ACNR</strong> • VOLUME 8 NUMBER 1 • MARCH/APRIL 2008
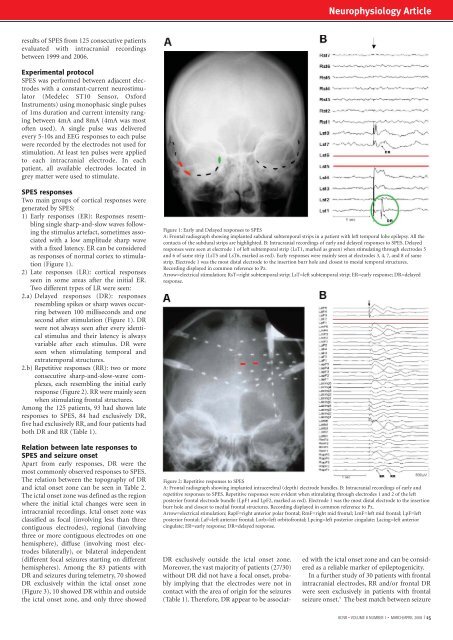
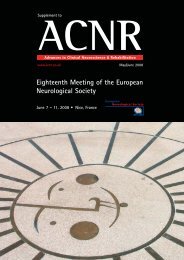
Neurophysiology Articleresults of SPES from 125 consecutive patientsevaluated with intracranial recordingsbetween 1999 and 2006.Experimental protocolSPES was performed between adjacent electrodeswith a constant-current neurostimulator(Medelec ST10 Sensor, OxfordInstruments) using monophasic single pulsesof 1ms duration and current intensity rangingbetween 4mA and 8mA (4mA was mostoften used). A single pulse was deliveredevery 5-10s and EEG responses to each pulsewere recorded by the electrodes not used forstimulation. At least ten pulses were appliedto each intracranial electrode. In eachpatient, all available electrodes located ingrey matter were used to stimulate.SPES responsesTwo main groups of cortical responses weregenerated by SPES:1) Early responses (ER): Responses resemblingsingle sharp-and-slow waves followingthe stimulus artefact, sometimes associatedwith a low amplitude sharp wavewith a fixed latency. ER can be consideredas responses of normal cortex to stimulation(Figure 1).2) Late responses (LR): cortical responsesseen in some areas after the initial ER.Two different types of LR were seen:2.a) Delayed responses (DR): responsesresembling spikes or sharp waves occurringbetween 100 milliseconds and onesecond after stimulation (Figure 1). DRwere not always seen after every identicalstimulus and their latency is alwaysvariable after each stimulus. DR wereseen when stimulating temporal andextratemporal structures.2.b) Repetitive responses (RR): two or moreconsecutive sharp-and-slow-wave complexes,each resembling the initial earlyresponse (Figure 2). RR were mainly seenwhen stimulating frontal structures.Among the 125 patients, 93 had shown lateresponses to SPES, 84 had exclusively DR,five had exclusively RR, and four patients hadboth DR and RR (Table 1).Relation between late responses toSPES and seizure onsetApart from early responses, DR were themost commonly observed responses to SPES.The relation between the topography of DRand ictal onset zone can be seen in Table 2.The ictal onset zone was defined as the regionwhere the initial ictal changes were seen inintracranial recordings. Ictal onset zone wasclassified as focal (involving less than threecontiguous electrodes), regional (involvingthree or more contiguous electrodes on onehemisphere), diffuse (involving most electrodesbilaterally), or bilateral independent(different focal seizures starting on differenthemispheres). Among the 83 patients withDR and seizures during telemetry, 70 showedDR exclusively within the ictal onset zone(Figure 3), 10 showed DR within and outsidethe ictal onset zone, and only three showedFigure 1: Early and Delayed responses to SPESA: Frontal radiograph showing implanted subdural subtemporal strips in a patient with left temporal lobe epilepsy. All thecontacts of the subdural strips are highlighted. B: Intracranial recordings of early and delayed responses to SPES. Delayedresponses were seen at electrode 1 of left subtemporal strip (LsT1, marked as green) when stimulating through electrodes 5and 6 of same strip (LsT5 and LsT6, marked as red). Early responses were mainly seen at electrodes 3, 4, 7, and 8 of samestrip. Electrode 1 was the most distal electrode to the insertion burr hole and closest to mesial temporal structures.Recording displayed in common reference to Pz.Arrow=electrical stimulation; RsT=right subtemporal strip; LsT=left subtemporal strip; ER=early response; DR=delayedresponse.Figure 2: Repetitive responses to SPESA: Frontal radiograph showing implanted intracerebral (depth) electrode bundles. B: Intracranial recordings of early andrepetitive responses to SPES. Repetitive responses were evident when stimulating through electrodes 1 and 2 of the leftposterior frontal electrode bundle (LpF1 and LpF2, marked as red). Electrode 1 was the most distal electrode to the insertionburr hole and closest to medial frontal structures. Recording displayed in common reference to Pz.Arrow=electrical stimulation; RapF=right anterior polar frontal; RmF=right mid frontal; LmF=left mid frontal; LpF=leftposterior frontal; LaF=left anterior frontal; Lorb=left orbitofrontal; Lpcing=left posterior cingulate; Lacing=left anteriorcingulate; ER=early response; DR=delayed response.DR exclusively outside the ictal onset zone.Moreover, the vast majority of patients (27/30)without DR did not have a focal onset, probablyimplying that the electrodes were not incontact with the area of origin for the seizures(Table 1). Therefore, DR appear to be associatedwith the ictal onset zone and can be consideredas a reliable marker of epileptogenicity.In a further study of 30 patients with frontalintracranial electrodes, RR and/or frontal DRwere seen exclusively in patients with frontalseizure onset. 5 The best match between seizure<strong>ACNR</strong> • VOLUME 8 NUMBER 1 • MARCH/APRIL 2008 I 15