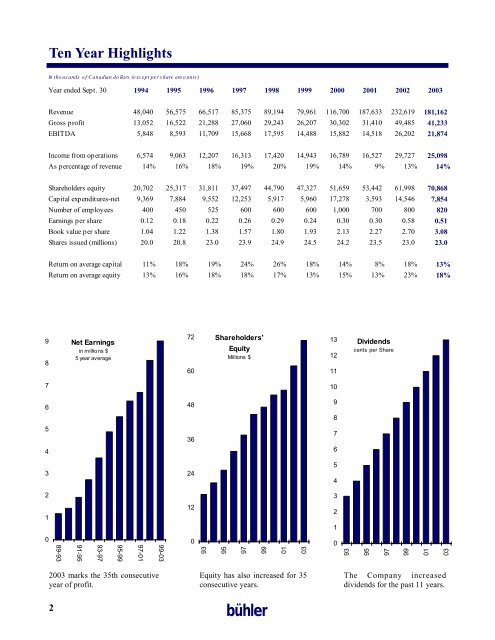
Ten Year HighlightsIn thous ands of Canadian dollars (except per share amounts )Year ended Sept. 30 1994 1995 1996 1997 1998 1999 2000 2001 2002 2003Revenue 48,040 56,575 66,517 85,375 89,194 79,961 116,700 187,633 232,619 181,162Gross profit 13,052 16,522 21,288 27,060 29,243 26,207 30,302 31,410 49,485 41,233EBITDA 5,848 8,593 11,709 15,668 17,595 14,488 15,882 14,518 26,202 21,874<strong>Inc</strong>ome from operations 6,574 9,063 12,207 16,313 17,420 14,943 16,789 16,527 29,727 25,098As percentage of revenue 14% 16% 18% 19% 20% 19% 14% 9% 13% 14%Shareholders equity 20,702 25,317 31,811 37,497 44,790 47,327 51,659 53,442 61,998 70,868Capital expenditures-net 9,369 7,884 9,552 12,253 5,917 5,960 17,278 3,593 14,546 7,854Number of employees 400 450 525 600 600 600 1,000 700 800 820Earnings per share 0.12 0.18 0.22 0.26 0.29 0.24 0.30 0.30 0.58 0.51Book value per share 1.04 1.22 1.38 1.57 1.80 1.93 2.13 2.27 2.70 3.08Shares issued (millions) 20.0 20.8 23.0 23.9 24.9 24.5 24.2 23.5 23.0 23.0Return on average capital 11% 18% 19% 24% 26% 18% 14% 8% 18% 13%Return on average equity 13% 16% 18% 18% 17% 13% 15% 13% 23% 18%98Net Earningsin millions $5 year average7260Shareholders'EquityMillions $131211Dividendscents per Share71064898536746324542311221089-9391-9593-9795-9997-0199-03093959799010309395979901032003 marks the 35th consecutiveyear of profit.Equity has also increased for 35consecutive years.The Company increaseddividends for the past 11 years.2bühler
To our ShareholdersJohn <strong>Buhler</strong>,Chairmanour company has nowY completed its 35th consecutiveyear of profit and equity increase.The year was filled with challenges,such as Mad Cow Disease, a strongCanadian dollar and the need toincrease the number of dealers forour Versatile division.In spite of all these challenges,management was able to show anincrease in gross margin from 21%to 23%, and increase EBITDAfrom 11% to 12% .The Company invested $3.7 million in development of newproducts and invested $7.8 million in new equipment andfacilities. These investments will contribute towards futuregrowth of revenue and earnings.I celebrated my 70th birthday this year and I am becomingless active in the day to day operations of the Company. Ihave also decided to divest some of my share holdings overa ten year period in order to make more shares available tothe public market. This will be done in an orderly mannerand will likely have a positive effect on the stock price.Management continues to operate the Company in aconservative manner, showing more concern for what theprofits will look like five years forward, as compared to thisyear’s profit. This is what good management is all about.Congratulations to our management team and all of ouremployees that take so much pride in the success and thefuture of their Company.Thank you.John <strong>Buhler</strong>,Chairman & CEOManagement Discussion & Financial AnalysisCraig Engel,President & COOe did it! 2003 was the yearW we needed to launch ourtractor products in the NorthAmerican market and establishourselves as an independent tractorand short line farm equipmentmanufacturer in the industry. TheCompany’s management group andI are very pleased to report that wemet our goals for Fiscal 2003 andare focused on continuing to growall aspects of our business, with theconservative approach which hasproven to be profitable.Tractor Operations:We have received an excellent response from our new andgrowing dealer base and their customers. Now, with over200 dealer outlets in North America, our tractor productsare increasing in exposure and accessibility. We continue toexpand our dealer base with high quality dealers who areproving to be loyal to our style of product and business.forage equipment continues to expand in exposure, eventhough this product group was most affected by BSE. Wewill continue to expand the territories in which our hay andforage products are marketed, in order to increase sales andalso reduce the impact of localized events.Financial:Our gross margin increased slightly over 2002, in spite ofthe weakened US dollar. Producing more of our owncomponents through vertical integration allows us controlof our product’s cost, quality and delivery. This has allcontributed to our ability to maintain or improve margins,without raising the selling price of our products.Our GS&A as a percent of sales rose slightly from last year,primarily due to last year’s abnormally high revenues. Weexpect our GS&A to remain under 9% of revenue.Our 10 year average return on capital and return on equityare each between 16% and 17%. Through patient growth,we expect to see these percentages approach 20% as in thepast.Short Line Products:In addition to the successful introduction of our tractorproducts, we also focused on our long standing short linefarm equipment. In spite of the serious implication of MadCow Disease (BSE) and the weakened US dollar, our frontend loaders, grain augers, compact implements, as well asour Implement Sales Company <strong>Inc</strong>.’s operations in Indianaand Arkansas, all experienced record sales. Our hay andOur accounts receivable and inventory levels have grownsignificantly during 2003. This is a direct result ofdiscontinuing the “build and pay to order” tractor sales toNew Holland, while at the same time, building our tractordealer direct business. In order to properly service this newand growing dealer base, we increased inventories andprovided wholesale financing programs to the tractordealers, similar to the successful model used for our shortbühler3