Chapter 6 – Confidence Intervals
Chapter 6 – Confidence Intervals
Chapter 6 – Confidence Intervals

You also want an ePaper? Increase the reach of your titles
YUMPU automatically turns print PDFs into web optimized ePapers that Google loves.
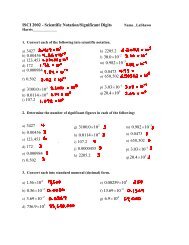
3. Similar to the case of , in practice it is not possible to know the true proportion, p.However, we can use sampling to estimate the value.4. Sample Proportion, ̅ <strong>–</strong> The fraction/percentage of a sample that have a characteristic ofinterest.# h h̅ = = 5. Example <strong>–</strong> Survey 200 people during the morning commute on a subway and find that 136will eat lunch out at a restaurant or shop, 52 brought their lunch, and 16 do not plan to eatlunch. Thus,̅ = = 0.68 = 68%̅ = = 0.26 = 26%̅ = = 0.06 = 6%6. Thus, we will use p to estimate p in a similar way that we used x to estimate μ.7. Casual inferences on proportions are ubiquitous perhaps because we as consumers ofmedia suck them up; we love to talk about them, tell our friends, blog about them, etc.However, the informed consumer of this onslaught of data wants to ask two importantquestions:• How was the data collected? Was it a simple random sample?• What population does the sample represent?Often, neither is addressed directly by the media supplying the statistics. Or, it is presentedas if the results pertain to the entire population of the USA when in fact that may not be thecase, depending on the answers to the questions above. If the answer is not clear, then youwant to be careful about any inferences you may draw.152