

2012PGY_GirlsFirst_Violence
2012PGY_GirlsFirst_Violence
2012PGY_GirlsFirst_Violence

Create successful ePaper yourself
Turn your PDF publications into a flip-book with our unique Google optimized e-Paper software.
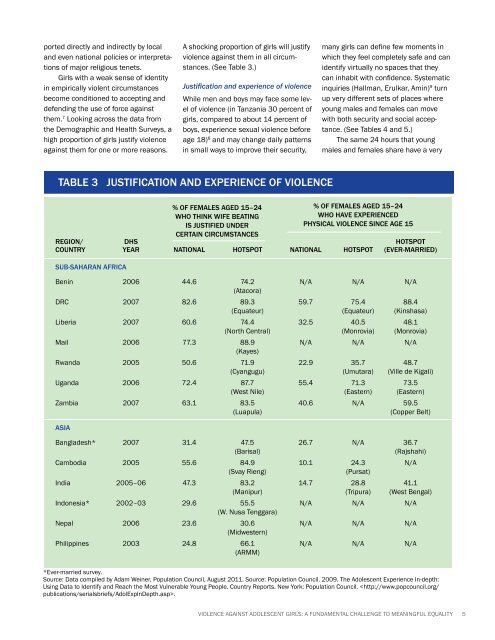
ported directly and indirectly by localand even national policies or interpretationsof major religious tenets.Girls with a weak sense of identityin empirically violent circumstancesbecome conditioned to accepting anddefending the use of force againstthem. 7 Looking across the data fromthe Demographic and Health Surveys, ahigh proportion of girls justify violenceagainst them for one or more reasons.A shocking proportion of girls will justifyviolence against them in all circumstances.(See Table 3.)Justification and experience of violenceWhile men and boys may face some levelof violence (in Tanzania 30 percent ofgirls, compared to about 14 percent ofboys, experience sexual violence beforeage 18) 8 and may change daily patternsin small ways to improve their security,many girls can define few moments inwhich they feel completely safe and canidentify virtually no spaces that theycan inhabit with confidence. Systematicinquiries (Hallman, Erulkar, Amin) 9 turnup very different sets of places whereyoung males and females can movewith both security and social acceptance.(See Tables 4 and 5.)The same 24 hours that youngmales and females share have a veryTable 3 justification and experience of violence% of females aged 15–24% of females aged 15–24who think wife beatingWHO have experiencedis justified underPHysical violence since age 15certain circumstancesRegion/ DHS HotspotCountry Year National Hotspot National Hotspot (Ever-married)Sub-saharan AfricaBenin 2006 44.6 74.2 N/A N/A N/A(Atacora)DRC 2007 82.6 89.3 59.7 75.4 88.4(Equateur) (Equateur) (Kinshasa)Liberia 2007 60.6 74.4 32.5 40.5 48.1(North Central) (Monrovia) (Monrovia)Mail 2006 77.3 88.9 N/A N/A N/A(Kayes)Rwanda 2005 50.6 71.9 22.9 35.7 48.7(Cyangugu) (Umutara) (Ville de Kigali)Uganda 2006 72.4 87.7 55.4 71.3 73.5(West Nile) (Eastern) (Eastern)Zambia 2007 63.1 83.5 40.6 N/A 59.5(Luapula)(Copper Belt)AsiaBangladesh* 2007 31.4 47.5 26.7 N/A 36.7(Barisal)(Rajshahi)Cambodia 2005 55.6 84.9 10.1 24.3 N/A(Svay Rieng)(Pursat)India 2005–06 47.3 83.2 14.7 28.8 41.1(Manipur) (Tripura) (West Bengal)Indonesia* 2002–03 29.6 55.5 N/A N/A N/A(W. Nusa Tenggara)Nepal 2006 23.6 30.6 N/A N/A N/A(Midwestern)Philippines 2003 24.8 66.1 N/A N/A N/A(ARMM)*Ever-married survey.Source: Data compiled by Adam Weiner, Population Council, August 2011. Source: Population Council. 2009. The Adolescent Experience In-depth:Using Data to Identify and Reach the Most Vulnerable Young People. Country Reports. New York: Population Council. .VIOLENCE AGAINST ADOLESCENT GIRLS: A FUNDAMENTAL CHALLENGE TO MEANINGFUL EQUALITY 5