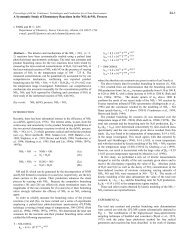
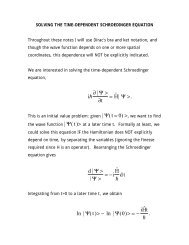
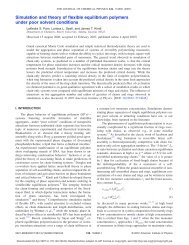
<strong>Thermal</strong> <strong>oxid<strong>at</strong>ion</strong> <strong>of</strong> <strong>HCN</strong> <strong>by</strong> NO 2 2Table 1. Reactions and R<strong>at</strong>e Constants Used in the Modeling<strong>of</strong> <strong>HCN</strong>/NO 2 System aReactions A B EFigure 1. Comparison <strong>of</strong> typical CO concentr<strong>at</strong>ion pr<strong>of</strong>ilewith modeled values: CO formed <strong>at</strong> 2017.4 K (mixture C, P= 0.556 <strong>at</strong>m).ing previous calibr<strong>at</strong>ion d<strong>at</strong>a (See Hsu and Lin (1984),Hsu et al. (1982), Hsu and Lin (1985)).Incident shocks were used to he<strong>at</strong> the reaction mixtureswith the following three compositions, <strong>HCN</strong> :NO 2 : Ar = 3.92:7.55:988.53 (A), 6:6:988 (B) and12.2:5.96:981.84 (C). The initial temper<strong>at</strong>ure, pressureand density <strong>of</strong> the shocked mixtures were computedwith the NASA/Lewis equilibrium program, whereasthe kinetics and energy release were simul<strong>at</strong>ed withCHEMKIN (See Kee et al. (1989)) and SENKIN (SeeLutz et al. (1988)) programs <strong>of</strong> Sandia N<strong>at</strong>ional Labor<strong>at</strong>ories.3. D<strong>at</strong>a analysis and resultsKinetic modeling <strong>of</strong> the concentr<strong>at</strong>ion-time pr<strong>of</strong>iles <strong>of</strong>NO, CO and H 2 O obtained from the shock tube experimentin the temper<strong>at</strong>ure range 1400 - 2500 K showsth<strong>at</strong> the CO and H 2 O pr<strong>of</strong>iles could not be s<strong>at</strong>isfactorilysimul<strong>at</strong>ed without including the isomeriz<strong>at</strong>ion reaction<strong>HCN</strong> = HNC and the subsequent processes, particularlyHNC + O. This is most evident in the low-temper<strong>at</strong>ure(673-773 K) reaction <strong>of</strong> <strong>HCN</strong> with NO 2 , which was foundto produce HNCO and CO 2 in the early stages. Theseproducts could be accounted for with the involvement <strong>of</strong>HNC (See Lin et al. (1992)).The mechanism, which can explain all aspects <strong>of</strong> theexperimental d<strong>at</strong>a obtained in this study, is summarizedin Table I. The mechanism modifies the <strong>HCN</strong> chemistry(See Miller and Bowman (1989)) <strong>by</strong> including thekey HNC <strong>oxid<strong>at</strong>ion</strong> processes (See Lin et al. (1992)). Amore detailed discussion on the mechanism will be presentedl<strong>at</strong>er.Figures 1-3 show typical concentr<strong>at</strong>ion-time pr<strong>of</strong>iles1. NO 2+M=O+NO+M 6.8E14 0.0 528502. O+NO 2=O 2+NO 1.0E13 0.0 6003. <strong>HCN</strong>=HNC 5.13E21 3.49 230134. HNC+O=NH+CO 5.44E12 0.0 05. HNC+OH=HNCO+H 2.8E13 0.0 37006. <strong>HCN</strong>+O=NCO+H 1.38E4 2.64 49807. <strong>HCN</strong>+O=NH+CO 3.45E3 2.64 49808. <strong>HCN</strong>+O=CN+OH 2.70E9 1.58 292009. <strong>HCN</strong>+OH=CN+H 2O 1.45E13 0.0 1093010. <strong>HCN</strong>+OH=HOCN+H 5.85E4 2.4 1250011. <strong>HCN</strong>+OH=HNCO+H 1.98E-3 4.0 100012. <strong>HCN</strong>+OH=NH 2+CO 7.83E-4 4.0 400013. HNC+O=H+NCO 1.6E1 3.08 -22414. HNC+OH=CN+H 2O 1.5E12 0.0 768015. HNC+NO 2=HNCO+NO 1.19E12 2.663 2359616. HOCN+H=HNCO+H 1.0E13 0.0 017. CO+OH=CO 2+H 1.51E7 1.3 -75818. N 2O+M=N 2+O+M 6.9E23 -2.5 6499519. CO+O+M=CO 2+M 6.17E14 0.0 300020. CN+O=CO+N 1.8E13 0.0 021. CN+O 2=NCO+O 5.6E12 0.0 022. CN+OH=NCO+H 6.0E13 0.0 023. CN+<strong>HCN</strong>=C 2N 2+H 1.5E7 1.71 153024. CN+NO 2=NCO+NO 7.0E15 -0.766 35825. CN+N 2O=NCN+NO 3.84E3 2.6 372026. CN+NO=NCO+N 3.6E12 0.0 2630027. N+NO=N 2+O 3.3E12 0.3 028. N+O 2=NO+O 6.4E9 1.0 628029. N 2O+O=N 2+O 2 4.3E12 0.0 1360030. N 2O+O=2NO 6.92E13 0.0 2680031. N 2O+H=N 2+OH 4.37E14 0.0 1888032. NH+O 2=HNO+O 3.89E13 0.0 1788033. NH+O 2=NO+OH 7.59E10 0.0 153034. NH+NO=N 2O+H 1.4E14 0.0 1280035. NH+NO=N 2+OH 3.2E13 0.0 1280036. NH+O=NO+H 4.68E13 0.0 037. NH+O=N+OH 3.09E13 0.0 038. H+O 2=O+OH 9.12E13 0.0 1471139. H 2+O=H+OH 5.0E4 2.67 629040. H 2+OH=H+H 2O 1.2E9 1.3 362641. H+HNCO=H 2+NCO 1.0E7 2.0 1590042. H+HNCO=NH 2+CO 1.1E14 0.0 1272043. OH+OH=H 2O+O 2.2E8 1.4 -40044. NO 2+H=NO+OH 3.5E14 0.0 150045. NO 2+NO 2=2NO+O 2 8.6E12 0.0 2880046. NO 2+NH=HNO+NO 1.0E11 0.5 398047. NO 2+NH 2=N 2O+H 2O 2.0E20 -3.0 048. NO 2+N=NO+NO 4.0E12 0.0 049. NO 2+N=N 2O+O 5.00E12 0.0 050. HNCO+O=NCO+OH 6.67E-4 4.55 178051. HNCO+O=HNO+CO 1.5E8 1.57 4430052. C 2N 2+O=NCO+CN 4.57E12 0.0 880053. C 2N 2+OH=HOCN+CN 1.86E11 0.0 290054. NCO+NO=N 2O+CO 6.4E16 -1.34 71555. NCO+NO=N 2+CO 2 5.8E18 -1.97 111256. NCO+M=N+CO+M 6.3E16 -0.5 4830057. NCO+N=N 2+CO 2.0E13 0.0 058. NCO+O=NO+CO 2.0E13 0.0 059. NCO+OH=NO+CO+H 1.0E13 0.0 0a R<strong>at</strong>e constants are given <strong>by</strong> k=AT B exp (-E/RT) in units <strong>of</strong>cm 3 , mole and sec, where E is in cal mol −1 . The mechanism isreduced from the original 78 reactions due to space limit<strong>at</strong>ion.for NO, CO and H 2 O obtained <strong>at</strong> different <strong>HCN</strong>/NO 2r<strong>at</strong>ios and temper<strong>at</strong>ures. The d<strong>at</strong>a points depict experimentalresults and the curves the kinetically modeledvalues, based on the mechanism in Table I. NO was foundto increase quickly during the initial stage <strong>of</strong> the reactionand decrease after passing through a maximun concentr<strong>at</strong>ion.After shock arrival, the concentr<strong>at</strong>ions <strong>of</strong> COPaper 8880 21st Intern<strong>at</strong>ional Symposium on Shock Waves, Gre<strong>at</strong> Keppel Island, Australia, July 20-25, 1997
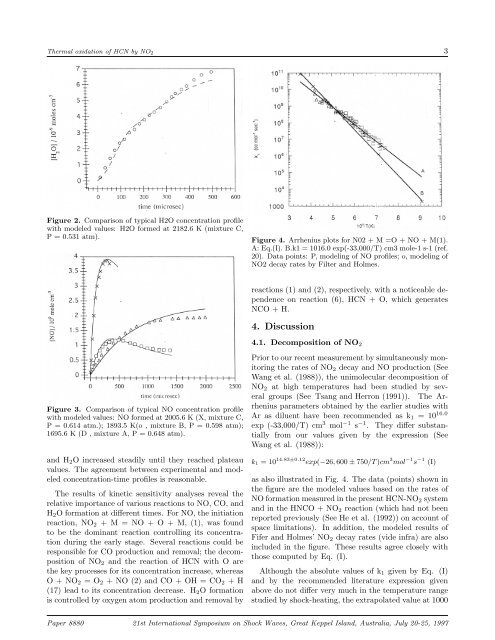
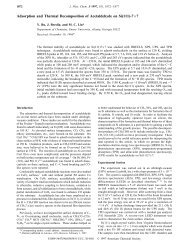
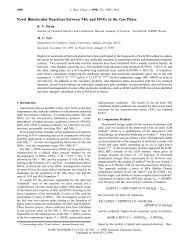
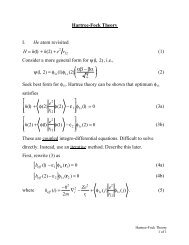
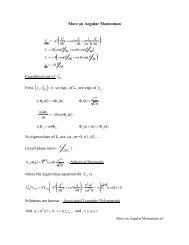
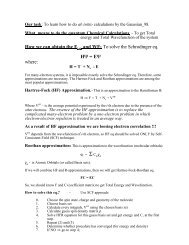
<strong>Thermal</strong> <strong>oxid<strong>at</strong>ion</strong> <strong>of</strong> <strong>HCN</strong> <strong>by</strong> NO 2 3Figure 2. Comparison <strong>of</strong> typical H2O concentr<strong>at</strong>ion pr<strong>of</strong>ilewith modeled values: H2O formed <strong>at</strong> 2182.6 K (mixture C,P = 0.531 <strong>at</strong>m).Figure 4. Arrhenius plots for N02 +M=O+NO+M(1).A: Eq.(I). B.k1 = 1016.0 exp(-33,000/T) cm3 mole-1 s-1 (ref.20). D<strong>at</strong>a points: P, modeling <strong>of</strong> NO pr<strong>of</strong>iles; o, modeling <strong>of</strong>NO2 decay r<strong>at</strong>es <strong>by</strong> Filter and Holmes.reactions (1) and (2), respectively, with a noticeable dependenceon reaction (6), <strong>HCN</strong> + O, which gener<strong>at</strong>esNCO+H.4. Discussion4.1. Decomposition <strong>of</strong> NO 2Figure 3. Comparison <strong>of</strong> typical NO concentr<strong>at</strong>ion pr<strong>of</strong>ilewith modeled values: NO formed <strong>at</strong> 2005.6 K (X, mixture C,P = 0.614 <strong>at</strong>m.); 1893.5 K(o , mixture B, P = 0.598 <strong>at</strong>m);1695.6 K (D , mixture A, P = 0.648 <strong>at</strong>m).and H 2 O increased steadily until they reached pl<strong>at</strong>eauvalues. The agreement between experimental and modeledconcentr<strong>at</strong>ion-time pr<strong>of</strong>iles is reasonable.The results <strong>of</strong> kinetic sensitivity analyses reveal therel<strong>at</strong>ive importance <strong>of</strong> various reactions to NO, CO, andH 2 O form<strong>at</strong>ion <strong>at</strong> different times. For NO, the initi<strong>at</strong>ionreaction, NO 2 +M=NO+O+M,(1), was foundto be the dominant reaction controlling its concentr<strong>at</strong>ionduring the early stage. Several reactions could beresponsible for CO production and removal; the decomposition<strong>of</strong> NO 2 and the reaction <strong>of</strong> <strong>HCN</strong> with O arethe key processes for its concentr<strong>at</strong>ion increase, whereasO+NO 2 =O 2 +NO(2)andCO+OH=CO 2 +H(17) lead to its concentr<strong>at</strong>ion decrease. H 2 O form<strong>at</strong>ionis controlled <strong>by</strong> oxygen <strong>at</strong>om production and removal <strong>by</strong>Prior to our recent measurement <strong>by</strong> simultaneously monitoringthe r<strong>at</strong>es <strong>of</strong> NO 2 decay and NO production (SeeWang et al. (1988)), the unimolecular decomposition <strong>of</strong>NO 2 <strong>at</strong> <strong>high</strong> temper<strong>at</strong>ures had been studied <strong>by</strong> severalgroups (See Tsang and Herron (1991)). The Arrheniusparameters obtained <strong>by</strong> the earlier studies withAr as diluent have been recommended as k 1 =10 16.0exp (-33,000/T) cm 3 mol −1 s −1 . They differ substantiallyfrom our values given <strong>by</strong> the expression (SeeWang et al. (1988)):k 1 =10 14.83±0.12 exp(−26, 600 ± 750/T )cm 3 mol −1 s −1 (I)as also illustr<strong>at</strong>ed in Fig. 4. The d<strong>at</strong>a (points) shown inthe figure are the modeled values based on the r<strong>at</strong>es <strong>of</strong>NO form<strong>at</strong>ion measured in the present <strong>HCN</strong>-NO 2 systemand in the HNCO + NO 2 reaction (which had not beenreported previously (See He et al. (1992)) on account <strong>of</strong>space limit<strong>at</strong>ions). In addition, the modeled results <strong>of</strong>Fifer and Holmes’ NO 2 decay r<strong>at</strong>es (vide infra) are alsoincluded in the figure. These results agree closely withthose computed <strong>by</strong> Eq. (I).Although the absolute values <strong>of</strong> k 1 given <strong>by</strong> Eq. (I)and <strong>by</strong> the recommended liter<strong>at</strong>ure expression givenabove do not differ very much in the temper<strong>at</strong>ure rangestudied <strong>by</strong> shock-he<strong>at</strong>ing, the extrapol<strong>at</strong>ed value <strong>at</strong> 1000Paper 8880 21st Intern<strong>at</strong>ional Symposium on Shock Waves, Gre<strong>at</strong> Keppel Island, Australia, July 20-25, 1997