Clark County School District Synergy Site Profile ... - NIUSI Leadscape
Clark County School District Synergy Site Profile ... - NIUSI Leadscape
Clark County School District Synergy Site Profile ... - NIUSI Leadscape
- No tags were found...

Create successful ePaper yourself
Turn your PDF publications into a flip-book with our unique Google optimized e-Paper software.
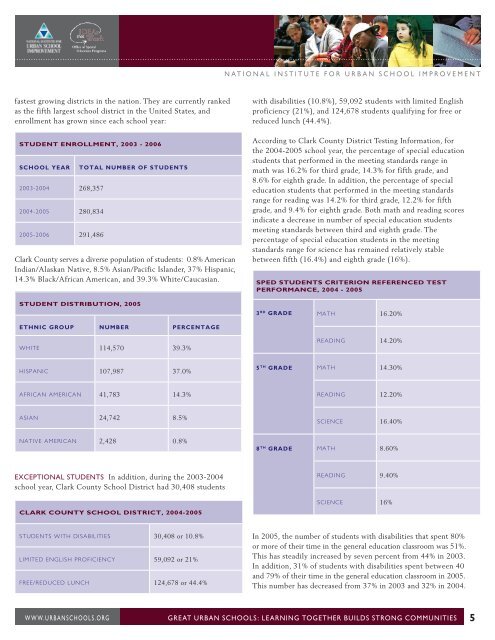
n a t i o n a l i n s t i t u t e f o r u r b a n s c h o o l i m p r o v e m e n tfastest growing districts in the nation. They are currently rankedas the fifth largest school district in the United States, andenrollment has grown since each school year:Student Enrollment, 2003 - 2006<strong>School</strong> Year2003-2004 268,3572004-2005 280,8342005-2006 291,486Total Number of Students<strong>Clark</strong> <strong>County</strong> serves a diverse population of students: 0.8% AmericanIndian/Alaskan Native, 8.5% Asian/Pacific Islander, 37% Hispanic,14.3% Black/African American, and 39.3% White/Caucasian.Student Distribution, 2005with disabilities (10.8%), 59,092 students with limited Englishproficiency (21%), and 124,678 students qualifying for free orreduced lunch (44.4%).According to <strong>Clark</strong> <strong>County</strong> <strong>District</strong> Testing Information, forthe 2004-2005 school year, the percentage of special educationstudents that performed in the meeting standards range inmath was 16.2% for third grade, 14.3% for fifth grade, and8.6% for eighth grade. In addition, the percentage of specialeducation students that performed in the meeting standardsrange for reading was 14.2% for third grade, 12.2% for fifthgrade, and 9.4% for eighth grade. Both math and reading scoresindicate a decrease in number of special education studentsmeeting standards between third and eighth grade. Thepercentage of special education students in the meetingstandards range for science has remained relatively stablebetween fifth (16.4%) and eighth grade (16%).SPED Students criterion referenced testperformance, 2004 - 20053 rd Grade Math 16.20%Ethnic Group Number PercentageWhite 114,570 39.3%Reading 14.20%Hispanic 107,987 37.0%5 th Grade Math 14.30%African American 41,783 14.3%Reading 12.20%Asian 24,742 8.5%Science 16.40%Native American 2,428 0.8%8 th Grade Math 8.60%Exceptional Students In addition, during the 2003-2004school year, <strong>Clark</strong> <strong>County</strong> <strong>School</strong> <strong>District</strong> had 30,408 students<strong>Clark</strong> <strong>County</strong> <strong>School</strong> <strong>District</strong>, 2004-2005Reading 9.40%Science 16%Students with Disabilities 30,408 or 10.8%Limited English Proficiency 59,092 or 21%Free/Reduced Lunch 124,678 or 44.4%In 2005, the number of students with disabilities that spent 80%or more of their time in the general education classroom was 51%.This has steadily increased by seven percent from 44% in 2003.In addition, 31% of students with disabilities spent between 40and 79% of their time in the general education classroom in 2005.This number has decreased from 37% in 2003 and 32% in 2004.w w w. u r b a n s c h o o l s . o rgGreat Urban <strong>School</strong>s : Learning Together Builds Strong Communities5