Profile of the Southern Illinois Enforcement Group - Illinois Criminal ...
Profile of the Southern Illinois Enforcement Group - Illinois Criminal ...
Profile of the Southern Illinois Enforcement Group - Illinois Criminal ...
Create successful ePaper yourself
Turn your PDF publications into a flip-book with our unique Google optimized e-Paper software.
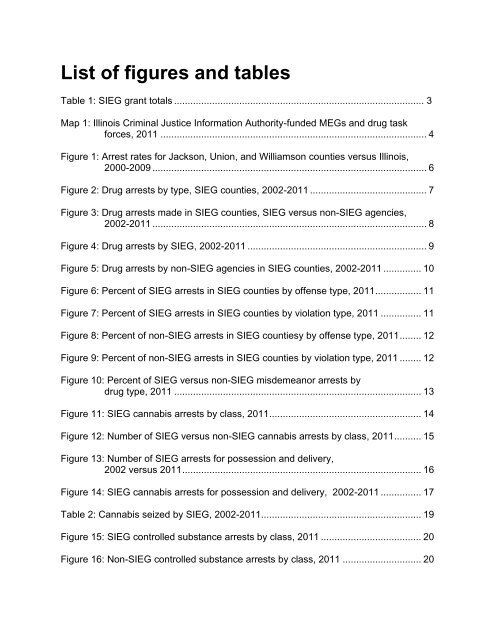
List <strong>of</strong> figures and tablesTable 1: SIEG grant totals ............................................................................................ 3Map 1: <strong>Illinois</strong> <strong>Criminal</strong> Justice Information Authority-funded MEGs and drug taskforces, 2011 .................................................................................................. 4Figure 1: Arrest rates for Jackson, Union, and Williamson counties versus <strong>Illinois</strong>,2000-2009 ..................................................................................................... 6Figure 2: Drug arrests by type, SIEG counties, 2002-2011 ........................................... 7Figure 3: Drug arrests made in SIEG counties, SIEG versus non-SIEG agencies,2002-2011 ..................................................................................................... 8Figure 4: Drug arrests by SIEG, 2002-2011 .................................................................. 9Figure 5: Drug arrests by non-SIEG agencies in SIEG counties, 2002-2011 .............. 10Figure 6: Percent <strong>of</strong> SIEG arrests in SIEG counties by <strong>of</strong>fense type, 2011 ................. 11Figure 7: Percent <strong>of</strong> SIEG arrests in SIEG counties by violation type, 2011 ............... 11Figure 8: Percent <strong>of</strong> non-SIEG arrests in SIEG countiesy by <strong>of</strong>fense type, 2011 ........ 12Figure 9: Percent <strong>of</strong> non-SIEG arrests in SIEG counties by violation type, 2011 ........ 12Figure 10: Percent <strong>of</strong> SIEG versus non-SIEG misdemeanor arrests bydrug type, 2011 ........................................................................................... 13Figure 11: SIEG cannabis arrests by class, 2011 ........................................................ 14Figure 12: Number <strong>of</strong> SIEG versus non-SIEG cannabis arrests by class, 2011 .......... 15Figure 13: Number <strong>of</strong> SIEG arrests for possession and delivery,2002 versus 2011 ........................................................................................ 16Figure 14: SIEG cannabis arrests for possession and delivery, 2002-2011 ............... 17Table 2: Cannabis seized by SIEG, 2002-2011........................................................... 19Figure 15: SIEG controlled substance arrests by class, 2011 ..................................... 20Figure 16: Non-SIEG controlled substance arrests by class, 2011 ............................. 20


