View PDF
View PDF
View PDF
- No tags were found...

You also want an ePaper? Increase the reach of your titles
YUMPU automatically turns print PDFs into web optimized ePapers that Google loves.
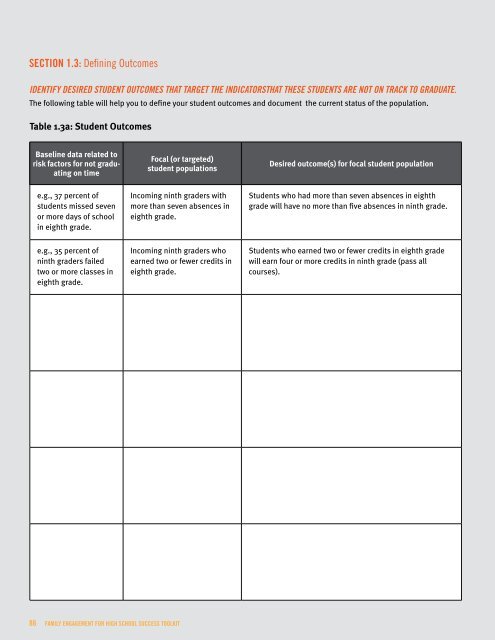
Section 1.3: Defining OutcomesIdentify desired student outcomes that target the indicatorsthat these students are not on track to graduate.The following table will help you to define your student outcomes and document the current status of the population.Table 1.3a: Student OutcomesBaseline data related torisk factors for not graduatingon timeFocal (or targeted)student populationsDesired outcome(s) for focal student populatione.g., 37 percent ofstudents missed sevenor more days of schoolin eighth grade.Incoming ninth graders withmore than seven absences ineighth grade.Students who had more than seven absences in eighthgrade will have no more than five absences in ninth grade.e.g., 35 percent ofninth graders failedtwo or more classes ineighth grade.Incoming ninth graders whoearned two or fewer credits ineighth grade.Students who earned two or fewer credits in eighth gradewill earn four or more credits in ninth grade (pass allcourses).86 Family Engagement for High School success Toolkit