Methodology of Ampacity Calculation for Overhead Line - Technical ...
Methodology of Ampacity Calculation for Overhead Line - Technical ...
Methodology of Ampacity Calculation for Overhead Line - Technical ...

You also want an ePaper? Increase the reach of your titles
YUMPU automatically turns print PDFs into web optimized ePapers that Google loves.
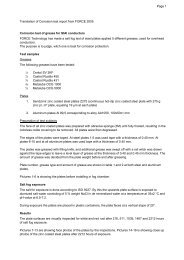
Page 3 <strong>of</strong> 8IEEE PES Transactions on Power Systems> REPLACE THIS LINE WITH YOUR PAPER IDENTIFICATION NUMBER (DOUBLE-CLICK HERE TO EDIT) < 3123456789101112131415161718192021222324252627282930313233343536373839404142434445464748495051525354555657585960A. ABL SimulationThe ABL simulation was per<strong>for</strong>med under the use <strong>of</strong>ANSYS CFX computational system [12]. Only four direction<strong>of</strong> the wind were considered at angles <strong>of</strong> 45°, 135°, 225° and315° (see Fig. 1). All these simultations were per<strong>for</strong>med usingon the inlet surface (see Fig. 6), a logarithmic boundarycondition with wind speed equal to 1 m/s at 10 m height fromthe ground and neutral atmosphere, i.e. the Froude numberexceeds 1000 (as in (11)). Analysing the numerical results, theset <strong>of</strong> spans belonging to S ww was identified, i.e., spans withwind speed less than 1 m/s. Of course, many other angles <strong>of</strong>incidence could have been considered to precisely identify thespans with lowest wind speed.Fig. 1. ABL simulation <strong>for</strong> different directions <strong>of</strong> wind speed.VI. AMPABL METHODOLOGYThe methodology proposed in this paper was developedbased on in<strong>for</strong>mation <strong>of</strong> wind speed (obtained from ABLsimulation) and span clearance <strong>of</strong> the whole transmission line(obtained from the transmission line design). AmpABLmethodology can be summarized in the following set <strong>of</strong> steps:1) Select the appropriate parameters <strong>of</strong> the overheadtransmission line to be analysed.2) Select the region <strong>of</strong> study (by digitalizing the topographicregion containing all spans <strong>of</strong> the overhead line) anddiscretize it using an appropriate mesh generator.3) Carry out simulations <strong>of</strong> the ABL as described in SectionV.4) Identify the spans to constitute the set S ww , as described insection IV.5) Identify the spans to compose the set S we , as described inthe Section IV.6) Take the intersection between S ww and S we to have the setS w∩e . Eliminate the dominated spans to have the nondominatedones. Store the identification number <strong>of</strong> nondominatedspans in a vector S c .7) Calculate the conductor temperature <strong>for</strong> all spansbelonging to S c , using the iterative method described insection III, considering the corresponding wind speeddetermined in step 4.8) Recalculate the clearances <strong>for</strong> all spans <strong>of</strong> S c .9) Identify the critical spans, i.e., least clearance and/orhottest conductor as described in section III.10) Calculate the steady-state thermal rating <strong>for</strong> the set <strong>of</strong>critical spans identified in step 9.The advantage <strong>of</strong> AmpABL methodology is to allow theidentification <strong>of</strong> critical spans without monitoring any spans <strong>of</strong>the whole overhead line. The monitoring and calculation <strong>of</strong>the dynamic rating in real time by conductor temperaturesensors are now possible to be made simply monitoring thecritical spans. The financial cost to supervise them is expectedto be lower if compared to other methodologies.VII. APPLICATION OF AMPABLThe proposed methodology AmpABL was applied indetermining the steady-state thermal rating [10] <strong>of</strong> a realoverhead line designed <strong>for</strong> the following parameters:1) Conductor Linnet or 336 MCM2) <strong>Line</strong> Voltage = 138 kV3) Solar radiation = 1000 W/m 24) Design wind speed <strong>of</strong> 1 m/s at 10 m height from theground5) Angle between the wind speed direction and theconductor axis equal to 90 degrees6) 1 PU = 510 A7) Ambient temperature = 30 °C8) TN: Normal Design Temperature <strong>of</strong> Condutor = 70 °C9) TE: Emergency Design Temperature = 90 °CA. Step 1: Parameters <strong>of</strong> the <strong>Overhead</strong> <strong>Line</strong>The overhead line has 133 spans distributed along 52 km <strong>of</strong>length in the region <strong>of</strong> Acuruí-MG, southeast <strong>of</strong> Brazil. Theminimum clearances, in all spans, were extracted directly fromthe design or calculated by using PLS-CADD [11]. Forpurposes <strong>of</strong> illustration one span is shown in Fig. 2.Fig. 2. Range <strong>of</strong> original pr<strong>of</strong>ile <strong>of</strong> the 138 kV overhead line.