A New Method for Comparing Numerical Simulations with ...
A New Method for Comparing Numerical Simulations with ...
A New Method for Comparing Numerical Simulations with ...

Create successful ePaper yourself
Turn your PDF publications into a flip-book with our unique Google optimized e-Paper software.
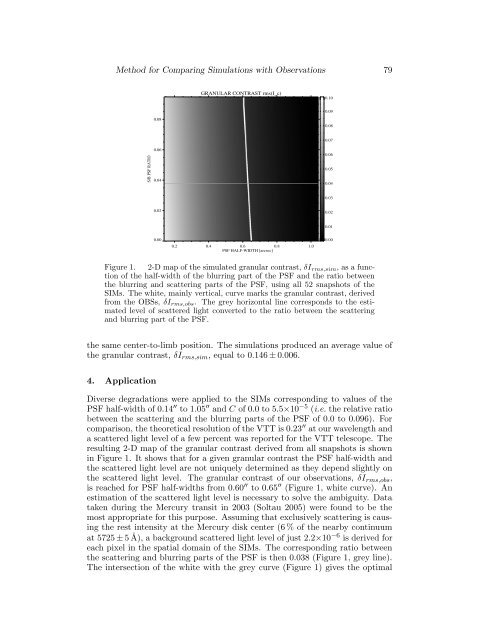
<strong>Method</strong> <strong>for</strong> <strong>Comparing</strong> <strong>Simulations</strong> <strong>with</strong> Observations 79GRANULAR CONTRAST rms(I_c)0.100.090.080.080.07S/B PSF RATIO0.060.040.060.050.040.030.020.020.010.000.2 0.4 0.6 0.8 1.0PSF HALF-WIDTH [arcsec]0.00Figure 1. 2-D map of the simulated granular contrast, δI rms,sim , as a functionof the half-width of the blurring part of the PSF and the ratio betweenthe blurring and scattering parts of the PSF, using all 52 snapshots of theSIMs. The white, mainly vertical, curve marks the granular contrast, derivedfrom the OBSs, δI rms,obs . The grey horizontal line corresponds to the estimatedlevel of scattered light converted to the ratio between the scatteringand blurring part of the PSF.the same center-to-limb position. The simulations produced an average value ofthe granular contrast, δI rms,sim , equal to 0.146 ± 0.006.4. ApplicationDiverse degradations were applied to the SIMs corresponding to values of thePSF half-width of 0.14 ′′ to 1.05 ′′ and C of 0.0 to 5.5×10 −5 (i.e. the relative ratiobetween the scattering and the blurring parts of the PSF of 0.0 to 0.096). Forcomparison, the theoretical resolution of the VTT is 0.23 ′′ at our wavelength anda scattered light level of a few percent was reported <strong>for</strong> the VTT telescope. Theresulting 2-D map of the granular contrast derived from all snapshots is shownin Figure 1. It shows that <strong>for</strong> a given granular contrast the PSF half-width andthe scattered light level are not uniquely determined as they depend slightly onthe scattered light level. The granular contrast of our observations, δI rms,obs ,is reached <strong>for</strong> PSF half-widths from 0.60 ′′ to 0.65 ′′ (Figure 1, white curve). Anestimation of the scattered light level is necessary to solve the ambiguity. Datataken during the Mercury transit in 2003 (Soltau 2005) were found to be themost appropriate <strong>for</strong> this purpose. Assuming that exclusively scattering is causingthe rest intensity at the Mercury disk center (6 % of the nearby continuumat 5725 ± 5 Å), a background scattered light level of just 2.2×10 −6 is derived <strong>for</strong>each pixel in the spatial domain of the SIMs. The corresponding ratio betweenthe scattering and blurring parts of the PSF is then 0.038 (Figure 1, grey line).The intersection of the white <strong>with</strong> the grey curve (Figure 1) gives the optimal