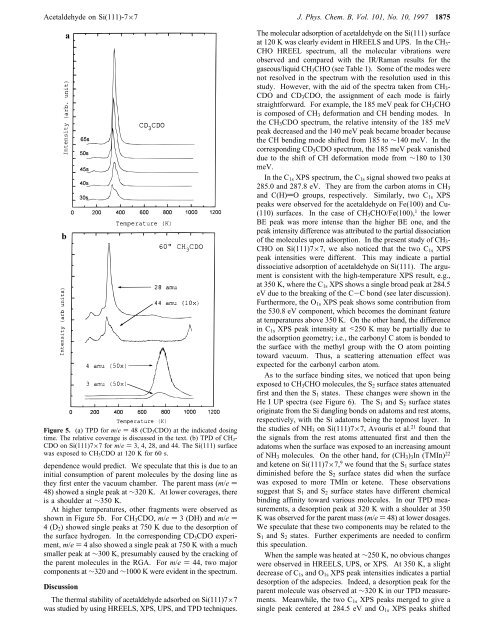
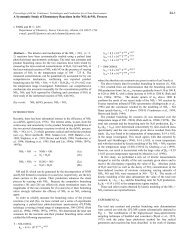
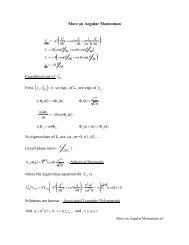
<str<strong>on</strong>g>Acetaldehyde</str<strong>on</strong>g> <strong>on</strong> <strong>Si</strong>(<strong>111</strong>)-7×7 J. Phys. Chem. B, Vol. 101, No. 10, 1997 1875baFigure 5. (a) TPD for m/e ) 48 (CD 3CDO) at the indicated dosingtime. The relative coverage is discussed in the text. (b) TPD <str<strong>on</strong>g>of</str<strong>on</strong>g> CH 3-CDO <strong>on</strong> <strong>Si</strong>(<strong>111</strong>)7×7 for m/e ) 3, 4, 28, <str<strong>on</strong>g>and</str<strong>on</strong>g> 44. The <strong>Si</strong>(<strong>111</strong>) surfacewas exposed to CH 3CDO at 120 K for 60 s.dependence would predict. We speculate that this is due to aninitial c<strong>on</strong>sumpti<strong>on</strong> <str<strong>on</strong>g>of</str<strong>on</strong>g> parent molecules by the dosing line asthey first enter the vacuum chamber. The parent mass (m/e )48) showed a single peak at ∼320 K. At lower coverages, thereis a shoulder at ∼350 K.At higher temperatures, other fragments were observed asshown in Figure 5b. For CH 3 CDO, m/e ) 3 (DH) <str<strong>on</strong>g>and</str<strong>on</strong>g> m/e )4(D 2 ) showed single peaks at 750 K due to the desorpti<strong>on</strong> <str<strong>on</strong>g>of</str<strong>on</strong>g>the surface hydrogen. In the corresp<strong>on</strong>ding CD 3 CDO experiment,m/e ) 4 also showed a single peak at 750 K with a muchsmaller peak at ∼300 K, presumably caused by the cracking <str<strong>on</strong>g>of</str<strong>on</strong>g>the parent molecules in the RGA. For m/e ) 44, two majorcomp<strong>on</strong>ents at ∼320 <str<strong>on</strong>g>and</str<strong>on</strong>g> ∼1000 K were evident in the spectrum.Discussi<strong>on</strong>The thermal stability <str<strong>on</strong>g>of</str<strong>on</strong>g> acetaldehyde adsorbed <strong>on</strong> <strong>Si</strong>(<strong>111</strong>)7×7was studied by using HREELS, XPS, UPS, <str<strong>on</strong>g>and</str<strong>on</strong>g> TPD techniques.The molecular adsorpti<strong>on</strong> <str<strong>on</strong>g>of</str<strong>on</strong>g> acetaldehyde <strong>on</strong> the <strong>Si</strong>(<strong>111</strong>) surfaceat 120 K was clearly evident in HREELS <str<strong>on</strong>g>and</str<strong>on</strong>g> UPS. In the CH 3 -CHO HREEL spectrum, all the molecular vibrati<strong>on</strong>s wereobserved <str<strong>on</strong>g>and</str<strong>on</strong>g> compared with the IR/Raman results for thegaseous/liquid CH 3 CHO (see Table 1). Some <str<strong>on</strong>g>of</str<strong>on</strong>g> the modes werenot resolved in the spectrum with the resoluti<strong>on</strong> used in thisstudy. However, with the aid <str<strong>on</strong>g>of</str<strong>on</strong>g> the spectra taken from CH 3 -CDO <str<strong>on</strong>g>and</str<strong>on</strong>g> CD 3 CDO, the assignment <str<strong>on</strong>g>of</str<strong>on</strong>g> each mode is fairlystraightforward. For example, the 185 meV peak for CH 3 CHOis composed <str<strong>on</strong>g>of</str<strong>on</strong>g> CH 3 deformati<strong>on</strong> <str<strong>on</strong>g>and</str<strong>on</strong>g> CH bending modes. Inthe CH 3 CDO spectrum, the relative intensity <str<strong>on</strong>g>of</str<strong>on</strong>g> the 185 meVpeak decreased <str<strong>on</strong>g>and</str<strong>on</strong>g> the 140 meV peak became broader becausethe CH bending mode shifted from 185 to ∼140 meV. In thecorresp<strong>on</strong>ding CD 3 CDO spectrum, the 185 meV peak vanisheddue to the shift <str<strong>on</strong>g>of</str<strong>on</strong>g> CH deformati<strong>on</strong> mode from ∼180 to 130meV.In the C 1s XPS spectrum, the C 1s signal showed two peaks at285.0 <str<strong>on</strong>g>and</str<strong>on</strong>g> 287.8 eV. They are from the carb<strong>on</strong> atoms in CH 3<str<strong>on</strong>g>and</str<strong>on</strong>g> C(H)dO groups, respectively. <strong>Si</strong>milarly, two C 1s XPSpeaks were observed for the acetaldehyde <strong>on</strong> Fe(100) <str<strong>on</strong>g>and</str<strong>on</strong>g> Cu-(110) surfaces. In the case <str<strong>on</strong>g>of</str<strong>on</strong>g> CH 3 CHO/Fe(100), 1 the lowerBE peak was more intense than the higher BE <strong>on</strong>e, <str<strong>on</strong>g>and</str<strong>on</strong>g> thepeak intensity difference was attributed to the partial dissociati<strong>on</strong><str<strong>on</strong>g>of</str<strong>on</strong>g> the molecules up<strong>on</strong> adsorpti<strong>on</strong>. In the present study <str<strong>on</strong>g>of</str<strong>on</strong>g> CH 3 -CHO <strong>on</strong> <strong>Si</strong>(<strong>111</strong>)7×7, we also noticed that the two C 1s XPSpeak intensities were different. This may indicate a partialdissociative adsorpti<strong>on</strong> <str<strong>on</strong>g>of</str<strong>on</strong>g> acetaldehyde <strong>on</strong> <strong>Si</strong>(<strong>111</strong>). The argumentis c<strong>on</strong>sistent with the high-temperature XPS result, e.g.,at 350 K, where the C 1s XPS shows a single broad peak at 284.5eV due to the breaking <str<strong>on</strong>g>of</str<strong>on</strong>g> the C-C b<strong>on</strong>d (see later discussi<strong>on</strong>).Furthermore, the O 1s XPS peak shows some c<strong>on</strong>tributi<strong>on</strong> fromthe 530.8 eV comp<strong>on</strong>ent, which becomes the dominant featureat temperatures above 350 K. On the other h<str<strong>on</strong>g>and</str<strong>on</strong>g>, the differencein C 1s XPS peak intensity at
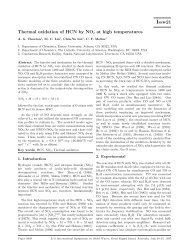
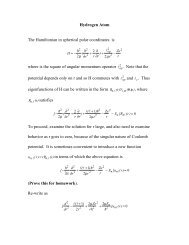
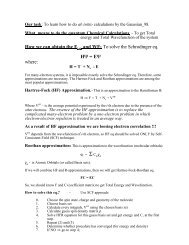
1876 J. Phys. Chem. B, Vol. 101, No. 10, 1997 Bu et al.Figure 6. He I (21.2 eV) UPS results <str<strong>on</strong>g>of</str<strong>on</strong>g> CH 3CHO <strong>on</strong> <strong>Si</strong>(<strong>111</strong>)-7×7.The surface was dosed at 120 K as indicated. The S 1 <str<strong>on</strong>g>and</str<strong>on</strong>g> S 2 surfacestates decreased as the surface was exposed to increasing amounts <str<strong>on</strong>g>of</str<strong>on</strong>g>CH 3CHO molecules.from 531.7 to 530.8 eV. In HREELS, the C-C stretching modeat 144 meV virtually disappeared, while an intense peak at ∼100meV appeared in the spectrum. A peak at 105 meV wasobserved in our earlier study <str<strong>on</strong>g>of</str<strong>on</strong>g> TMIn <strong>on</strong> <strong>Si</strong>(<strong>111</strong>)7×7 whenthe surface was heated to 520 K to break the In-C b<strong>on</strong>ds. 22The peak was assigned to the CH 3 deformati<strong>on</strong> mode for theCH 3 group <strong>on</strong> <strong>Si</strong>(<strong>111</strong>)7×7, which was discussed in detail inref 22. Another intense peak at 128 meV is likely due to the<strong>Si</strong>-O b<strong>on</strong>d, which persisted up to 700 K, while a small humpappeared at ∼208 meV, which is red-shifted by more than 10meV as compared to a normal carb<strong>on</strong>yl CO double b<strong>on</strong>d. Thisred shift, coupled with the 128 meV <strong>Si</strong>-O stretching mode <str<strong>on</strong>g>and</str<strong>on</strong>g>the observed C 1s XPS peak shifting, indicates the formati<strong>on</strong> <str<strong>on</strong>g>of</str<strong>on</strong>g>the <strong>Si</strong>-O b<strong>on</strong>d <str<strong>on</strong>g>and</str<strong>on</strong>g> thus the weakening <str<strong>on</strong>g>of</str<strong>on</strong>g> the CO b<strong>on</strong>d. Inthe corresp<strong>on</strong>ding UPS spectra, the two peaks at 5.7 <str<strong>on</strong>g>and</str<strong>on</strong>g> 10.0eV due to 10a′ <str<strong>on</strong>g>and</str<strong>on</strong>g> 1a′′ molecular orbitals attenuated significantly,<str<strong>on</strong>g>and</str<strong>on</strong>g> a new peak at ∼6.5 eV was noted. The 5.7 eVpeak is associated with the O l<strong>on</strong>e electr<strong>on</strong> pairs; its peakintensity decrease suggests the formati<strong>on</strong> <str<strong>on</strong>g>of</str<strong>on</strong>g> an <strong>Si</strong>-O b<strong>on</strong>d,which is c<strong>on</strong>sistent with the HREELS results discussed above.The 10.0 eV peak has the character <str<strong>on</strong>g>of</str<strong>on</strong>g> a π CH 3 b<strong>on</strong>d, <str<strong>on</strong>g>and</str<strong>on</strong>g> itspeak intensity attenuati<strong>on</strong> is likely due to the C-C b<strong>on</strong>dbreaking <str<strong>on</strong>g>and</str<strong>on</strong>g> the migrati<strong>on</strong> <str<strong>on</strong>g>of</str<strong>on</strong>g> the CH 3 group from CH 3 CHO<strong>on</strong>to the substrate. The appearance <str<strong>on</strong>g>of</str<strong>on</strong>g> the new 6.5 eV peak isattributable to the formati<strong>on</strong> <str<strong>on</strong>g>of</str<strong>on</strong>g> the <strong>Si</strong>-C b<strong>on</strong>d (i.e., <strong>Si</strong>-CH 3species) <str<strong>on</strong>g>and</str<strong>on</strong>g> the <strong>Si</strong>-O b<strong>on</strong>d. The aforementi<strong>on</strong>ed changes inboth HREELS <str<strong>on</strong>g>and</str<strong>on</strong>g> UPS indicate the break <str<strong>on</strong>g>of</str<strong>on</strong>g> the C-C b<strong>on</strong>d<str<strong>on</strong>g>and</str<strong>on</strong>g> the formati<strong>on</strong> <str<strong>on</strong>g>of</str<strong>on</strong>g> <strong>Si</strong>-CH 3 species at 350 K.Further heating the sample to 550 K caused the disappearance<str<strong>on</strong>g>of</str<strong>on</strong>g> the ∼100 meV HREELS peak <str<strong>on</strong>g>and</str<strong>on</strong>g> the appearance <str<strong>on</strong>g>of</str<strong>on</strong>g> a newpeak at ∼270 meV attributable to the <strong>Si</strong>-H stretching mode.These simultaneous changes indicate the cracking <str<strong>on</strong>g>of</str<strong>on</strong>g> the CHb<strong>on</strong>d <str<strong>on</strong>g>and</str<strong>on</strong>g> the formati<strong>on</strong> <str<strong>on</strong>g>of</str<strong>on</strong>g> the <strong>Si</strong>-H species. The <strong>Si</strong>-Hstretching mode at ∼270 meV, being a little higher than that <str<strong>on</strong>g>of</str<strong>on</strong>g>∼260 meV for H <strong>on</strong> a clean <strong>Si</strong> surface, is probably caused bythe <strong>Si</strong> atoms back-b<strong>on</strong>ded to O atoms. At higher temperatures,CH x -related features decreased in intensity, indicating a furtherbreaking <str<strong>on</strong>g>of</str<strong>on</strong>g> the CH b<strong>on</strong>d. Above 800 K, the HREELS spectrafor all acetaldehyde isotopes are dominated by a single peak at110 meV, which can be ascribed to the formati<strong>on</strong> <str<strong>on</strong>g>of</str<strong>on</strong>g> <strong>Si</strong>C, 22 whilethe <strong>Si</strong>-O stretching mode at 128 meV vanished. In thecorresp<strong>on</strong>ding XPS results, the O 1s XPS peak virtually disappeared,<str<strong>on</strong>g>and</str<strong>on</strong>g> the C 1s XPS peak shifted to 282.8 eV at >800 K.In the UPS spectra, the intense peak at ∼6.5 eV diminished<str<strong>on</strong>g>and</str<strong>on</strong>g> the spectrum at 1150 K was similar to that <str<strong>on</strong>g>of</str<strong>on</strong>g> the cleansurface, except for the presence <str<strong>on</strong>g>of</str<strong>on</strong>g> a weak <strong>Si</strong>-C feature at ∼7eV. In the TPD measurement, two peaks were noted for them/e ) 44 at ∼320 <str<strong>on</strong>g>and</str<strong>on</strong>g> ∼1000 K. The lower temperature <strong>on</strong>e(∼320 K) follows the parent pr<str<strong>on</strong>g>of</str<strong>on</strong>g>ile, while the higher temperature<strong>on</strong>e (∼1000 K) is attributed to the <strong>Si</strong>O species. Thisobservati<strong>on</strong> is c<strong>on</strong>sistent with our surface analysis results, wherethe O-related features, e.g., O 1s XPS peak <str<strong>on</strong>g>and</str<strong>on</strong>g> the 128 meVpeak in HREELS, practically vanished above 1000 K. We alsoexamined the possible product CO (m/e ) 28), but the resultswere not c<strong>on</strong>clusive. As can be seen in Figure 5b, the dominantpeak at ∼320 K again follows the parent pr<str<strong>on</strong>g>of</str<strong>on</strong>g>ile, while a smallhump at ∼680 K was not observed in the parent spectrum.However, a similar hump was evident in the m/e ) 44 (<strong>Si</strong>O)spectrum; this hump may have resulted from <strong>Si</strong> + i<strong>on</strong> fragment.The decompositi<strong>on</strong> process described above can be summarizedas follows:120-250 KCH 3 CHO(g)98 CH3 CHO(a)∼350 K98 CH3 (a) + CHO(a) + CH 3 CHO(g)∼450-700 K98 CHx (a) + HO(a) + O(a)∼1150 K98 C(a)C<strong>on</strong>clusi<strong>on</strong>The adsorpti<strong>on</strong> <str<strong>on</strong>g>and</str<strong>on</strong>g> thermal decompositi<strong>on</strong> <str<strong>on</strong>g>of</str<strong>on</strong>g> CH 3 CHO, CH 3 -CDO, <str<strong>on</strong>g>and</str<strong>on</strong>g> CD 3 CDO <strong>on</strong> <strong>Si</strong>(<strong>111</strong>)7×7 have been studied withHREELS, XPS, TPD, <str<strong>on</strong>g>and</str<strong>on</strong>g> UPS. <str<strong>on</strong>g>Acetaldehyde</str<strong>on</strong>g> was found toadsorb molecularly <strong>on</strong> the surface at 120 K. However, somedissociative adsorpti<strong>on</strong> may also have occurred according toour XPS results. No obvious changes were noted when thesample was heated to 250 K. At 350 K, <strong>on</strong> the other h<str<strong>on</strong>g>and</str<strong>on</strong>g>, thebreaking <str<strong>on</strong>g>of</str<strong>on</strong>g> the C-C b<strong>on</strong>d, the formati<strong>on</strong> <str<strong>on</strong>g>of</str<strong>on</strong>g> the <strong>Si</strong>-O b<strong>on</strong>d,<str<strong>on</strong>g>and</str<strong>on</strong>g> the CH 3 groups <strong>on</strong> the surface were indicated by HREELS<str<strong>on</strong>g>and</str<strong>on</strong>g> UPS spectra. A partial desorpti<strong>on</strong> <str<strong>on</strong>g>of</str<strong>on</strong>g> the parent moleculewas also revealed by the decrease <str<strong>on</strong>g>of</str<strong>on</strong>g> the C <str<strong>on</strong>g>and</str<strong>on</strong>g> O XPS peakintensity <str<strong>on</strong>g>and</str<strong>on</strong>g> the appearance <str<strong>on</strong>g>of</str<strong>on</strong>g> a desorpti<strong>on</strong> peak at ∼320 Kfor the parent molecule. Further heating the sample to 700 Kcaused the decompositi<strong>on</strong> <str<strong>on</strong>g>of</str<strong>on</strong>g> the CH 3 adspecies <str<strong>on</strong>g>and</str<strong>on</strong>g> theformati<strong>on</strong> <str<strong>on</strong>g>of</str<strong>on</strong>g> <strong>Si</strong>-H species. Finally, at 1150 K, O-c<strong>on</strong>tainingspecies <str<strong>on</strong>g>and</str<strong>on</strong>g> H adspecies desorbed from the surface, while Cremained <strong>on</strong> the substrate to form silic<strong>on</strong> carbide.Acknowledgment. The authors gratefully acknowledge thesupport <str<strong>on</strong>g>of</str<strong>on</strong>g> this work by the Office <str<strong>on</strong>g>of</str<strong>on</strong>g> Naval Research.References <str<strong>on</strong>g>and</str<strong>on</strong>g> Notes(1) Benziger, J. B.; Madix, R. J. J. Catal. 1982, 74, 55.(2) Prabhakaran, K.; Rao, C. N. R. Appl. Surf. Sci. 1990, 44, 205.(3) Yash<strong>on</strong>ath, S.; Basu, P. K.; Srinivasan, A.; Hegde, M. S.; Rao, C.N. R. Proc.sIndian Acad. Sci., Chem. Sci. 1982, 91, 101.(4) Bowker, M.; Madix, R. J. Vacuum 1981, 31, 711.(5) Cases, F.; Vazquez, J. L.; Perez, J. M.; Aldaz, A.; Clavilier, J. J.Electroanal. Chem. Interfacial Electrochem. 1990, 281, 283.(6) Perez, J. M.; Cases, F.; Vazquez, J. L.; Aldaz, A. New J. Chem.1990, 14, 679.(7) Idriss, H.; Diagne, C.; Hinderman, J. P.; Kiennemann, A.; Barteau,M. A. J. Catal. 1995, 155, 219.