- Page 2:
2010 PLAYOFF GUIDESECTION ONE: 2010
- Page 7 and 8:
CONFERENCE QUARTERFINALSWednesday,
- Page 9 and 10:
STANLEY CUP PLAYOFF SCHEDULEEASTERN
- Page 11 and 12:
National Hockey League Career Stati
- Page 13 and 14:
National Hockey League Career Stati
- Page 15 and 16:
National Hockey League Career Stati
- Page 17 and 18:
National Hockey League Career Stati
- Page 19 and 20:
National Hockey League Career Stati
- Page 23 and 24:
National Hockey League Career Stati
- Page 25 and 26:
No Player GP G A PTSPIM PP SH GW S
- Page 27:
Nashville Predators 2004 Playoff Sc
- Page 30 and 31:
PREDATORS IN ELITE CLASS WITH FIVE
- Page 32 and 33:
WEBER SCORES GOALSA season after ty
- Page 34 and 35:
2009-2010 Players By Team - Nashvil
- Page 36 and 37:
2009-10 NASHVILLE PREDATORSSCORING
- Page 38 and 39:
Player scoring by period/Record whe
- Page 40 and 41:
2009-2010 - Nashville Predators Tim
- Page 42 and 43:
2009-10 Goals and Shots PeriodPREDA
- Page 44 and 45:
2009-10 Game NotesOverall Record: 4
- Page 46 and 47:
The Last Time…The last time… HO
- Page 48 and 49:
TRAINING CAMPSeptember 16, 2009:Sep
- Page 50 and 51:
2009-10 in Overtime/ShootoutsHOME R
- Page 52 and 53:
2009-10 SHOOTOUT RESULTSOCTOBER 3,
- Page 54 and 55:
Nashville ShootersOpposing Shooters
- Page 56 and 57:
PREVIOUS RECORDLONGEST WINNING STRE
- Page 58 and 59:
MOST SHORTHANDED GOALS AGAINSTAt Ho
- Page 60 and 61:
Tied and Broken Records in 2009-10P
- Page 62 and 63:
Tied and Broken Records in 2009-10P
- Page 64:
Tied and Broken Records in 2009-10P
- Page 67 and 68:
NASHVILLE PREDATORS vs. ATLANTA THR
- Page 69 and 70:
NASHVILLE PREDATORS vs. BUFFALO SAB
- Page 71 and 72:
NASHVILLE PREDATORS vs. CAROLINA HU
- Page 73 and 74:
NASHVILLE PREDATORS vs. COLORADO AV
- Page 75 and 76:
NASHVILLE PREDATORS vs. DALLAS STAR
- Page 77 and 78:
NASHVILLE PREDATORS vs. EDMONTON OI
- Page 79 and 80:
NASHVILLE PREDATORS vs. LOS ANGELES
- Page 81 and 82:
NASHVILLE PREDATORS vs. MONTREAL CA
- Page 83 and 84:
NASHVILLE PREDATORS vs. NEW YORK IS
- Page 85 and 86:
NASHVILLE PREDATORS vs. OTTAWA SENA
- Page 87 and 88:
NASHVILLE PREDATORS vs. PHOENIX COY
- Page 89 and 90:
NASHVILLE PREDATORS vs. SAN JOSE SH
- Page 91 and 92:
NASHVILLE PREDATORS vs. TAMPA BAY L
- Page 93 and 94:
NASHVILLE PREDATORS vs. VANCOUVER C
- Page 96 and 97:
SECTION THREE:THE PLAYERS
- Page 98 and 99:
How the Predators were builtENTRY D
- Page 100 and 101:
DEFENSE Height Weight Shoots Place
- Page 102 and 103:
DateOpp.LEGWAND THURESSON SPALING B
- Page 104 and 105:
DateOpp.JONES#28WARD#29FRANSON#32WI
- Page 106 and 107:
Nashville Predators: Head Coach Bar
- Page 108 and 109:
No. 19 JASON ARNOTTDate H/R Team Op
- Page 110 and 111:
NO. 3 WADE BELAKDate H/R Team Opp G
- Page 112 and 113: NO. 51 FRANCIS BOUILLONDate H/R Tea
- Page 114 and 115: NO. 14 DUSTIN BOYDDate H/R Team Opp
- Page 116 and 117: NO. 71 JP DUMONTDate H/R Team Opp G
- Page 118 and 119: NO. 39 DAN ELLISDate H/R Team Opp D
- Page 120 and 121: NO. 10 MARTIN ERATDate H/R Team Opp
- Page 122 and 123: NO. 32 CODY FRANSONDate H/R Team Op
- Page 124 and 125: NO. 9 MARCEL GOCDate H/R Team Opp G
- Page 126 and 127: NO. 37 DENIS GREBESHKOVDate H/R Tea
- Page 128 and 129: NO. 2 DAN HAMHUISDate H/R Team Opp
- Page 130 and 131: NO. 27 PATRIC HORNQVISTDate H/R Tea
- Page 132 and 133: NO. 8 KEVIN KLEINDate H/R Team Opp
- Page 134 and 135: NO. 11 DAVID LEGWANDDate H/R Team O
- Page 136 and 137: NO. 16 CAL O'REILLYDate H/R Team Op
- Page 138 and 139: NO. 35 PEKKA RINNEDate H/R Team Opp
- Page 140 and 141: NO. 25 JERRED SMITHSONDate H/R Team
- Page 142 and 143: NO. 13 NICK SPALINGDate H/R Team Op
- Page 144 and 145: NO. 26 STEVE SULLIVANDate H/R Team
- Page 146 and 147: NO. 20 RYAN SUTERDate H/R Team Opp
- Page 148 and 149: NO. 22 JORDIN TOOTOODate H/R Team O
- Page 150 and 151: NO. 29 JOEL WARDDate H/R Team Opp G
- Page 152 and 153: NO. 6 SHEA WEBERDate H/R Team Opp G
- Page 154 and 155: NO. 33 COLIN WILSONDate H/R Team Op
- Page 156 and 157: Milwaukee Admirals ScoringFinal 200
- Page 158 and 159: EUROPEAN PROSPECT SCORING(as of gam
- Page 160 and 161: ADDITIONAL PROSPECT NOTESAmerican H
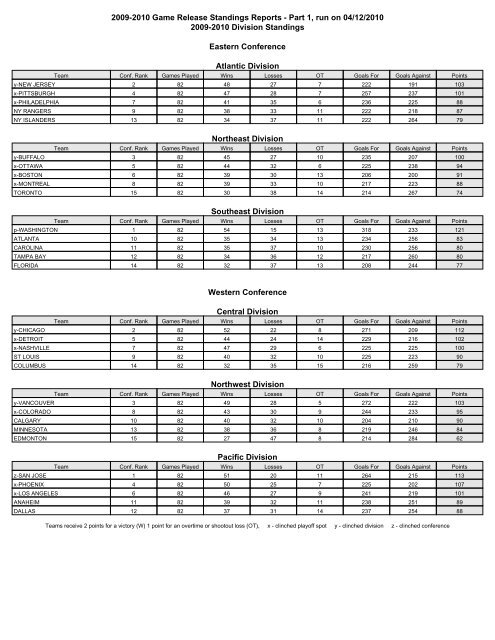
- Page 162: SECTION FOUR:FINAL NHLREGULAR SEASO
- Page 167 and 168: 2009-2010 Division Standings with R
- Page 169 and 170: 2009-2010 Team Record - Last Ten Ga
- Page 171 and 172: 2009-2010 Home Record - Eastern Con
- Page 173 and 174: 2009-2010 Power Play / Penalty Kill
- Page 175 and 176: 2009-2010 Game Release Individual S
- Page 177 and 178: Power Play PointsRK Player Team GP
- Page 179 and 180: 2009-2010 Individual Rookie Scoring
- Page 181 and 182: Rookie ShotsRK Player Team GP S1 *
- Page 183 and 184: 2009-2010 Record of GoaltendersSw #
- Page 185 and 186: 39 Rick Dipietro 8 462 2.60 2 5 0 1
- Page 187 and 188: 2009-2010 Players By Team - Boston
- Page 189 and 190: 2009-2010 Players By Team - Chicago
- Page 191 and 192: 2009-2010 Players By Team - Columbu
- Page 193 and 194: 2009-2010 Players By Team - Detroit
- Page 195 and 196: 2009-2010 Players By Team - Florida
- Page 197 and 198: 2009-2010 Players By Team - Minneso
- Page 199 and 200: 2009-2010 Players By Team - Nashvil
- Page 201 and 202: 2009-2010 Players By Team - New Yor
- Page 203 and 204: 2009-2010 Players By Team - Ottawa
- Page 205 and 206: 2009-2010 Players By Team - Phoenix
- Page 207 and 208: 2009-2010 Players By Team - San Jos
- Page 209 and 210: 2009-2010 Players By Team - Tampa B
- Page 211 and 212: 2009-2010 Players By Team - Vancouv
- Page 213 and 214:
2009-2010 Consecutive Scoring Strea
- Page 215 and 216:
8 Stamkos, Steven TAMPA BAY 12 Oct
- Page 217 and 218:
5 Savard, Marc BOSTON 21 Dec '09 30
- Page 219 and 220:
Perron, David 3 ST LOUIS 10 Nov '09
- Page 221 and 222:
4 ATLANTA 08 Nov '09 15 Nov '094 WA
- Page 223 and 224:
4 SAN JOSE 28 Oct '09 10 Nov '094 N
- Page 225 and 226:
2009-2010 Player Movement, run on 0
- Page 227 and 228:
Total 76 4 25 29 2 37 2 0 0 120 3.3
- Page 229 and 230:
2009-2010 Penalties by Team, run on
- Page 231 and 232:
1014 13 Mar '10 Bryan Allen 4 02:46
- Page 233 and 234:
2009-2010 Prior Week Results and Up