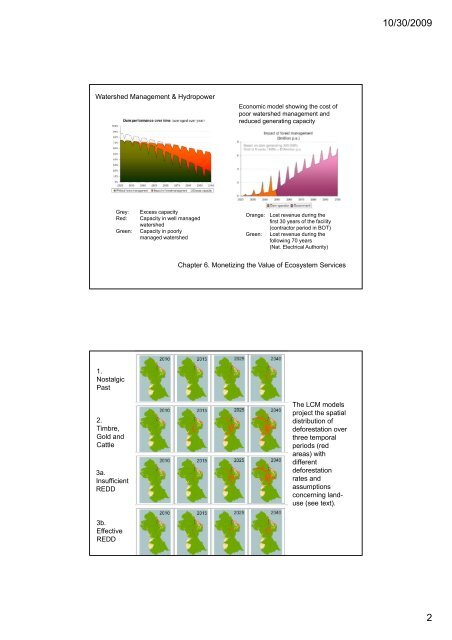
10/30/2009<strong>Watershed</strong> Management & HydropowerEconomic model showing the cost ofpoor watershed <strong>management</strong> <strong>and</strong>reduced generating capacityGrey:Red:Green:Excess capacityCapacity in well managedwatershedCapacity in poorlymanaged watershedOrange:Green:Lost revenue during thefirst 30 years of the facility(contractor period in BOT)Lost revenue during thefollowing 70 years(Nat. Electrical Authority)Chapter 6. Monetizing the Value of Ecosystem Services1.NostalgicPastThe LCM modelsproject the spatial2.distribution ib ti ofTimbre,deforestation overGold <strong>and</strong>three temporalCattleperiods (redareas) withdifferent3a.deforestationInsufficientrates <strong>and</strong>REDDassumptionsconcerning l<strong>and</strong>use(see text).3b.EffectiveREDD2
10/30/2009Millions tCO21,8001,6001,4001,2001,000800600400200-20102012201420162018Cumulative National Emissions (tons CO2)BAU vs Effective REDDBusiness As UsualEffective REDD20342032203020282026202420222020203620382040Mean AnnualEmissionsReductions =44.827m tCO2Potential REDD revenuesprojected over a 30 yearperiod based on a comparisonbetween the Cattle, Gold <strong>and</strong>Timber Scenario (2) as thereference scenario <strong>and</strong> theEffective REDD scenario (3b)as the eventual outcome; inboth instances, the modelcontemplates bothdeforestation <strong>and</strong> forestdegradation.Emissions Reductions in Effective REDD (tons CO2)Total Emissions ReductionsOver 30yr 1,389,662,918Mean AnnualReductions 44,827,836Effective REDD 30yr Revenue Projections$2/ton CO2 $5/ton $10/tonTotal Revenue Constant USD $2,779,325,836 $6,948,314,591 $13,896,629,182Mean Annual Revenue $ 89,655,672 $ 224,139,180 $ 448,278,361Mean Annual Revenue (disc) $ 26,593,587 $ 66,483,969 $ 132,967,937NPV @ 10% $815,606,897 $2,039,017,242 $4,078,034,483Potential National REDD RevenueEffective REDD ScenarioUSDM illions$350$300$250$304Discounted Annual Flows @ $2 tCO2Discounted Annual Flows @ $5 tCO2Discounted Annual Flows @ $10 tCO2Cumulative Emissions Reductions1,6001,4001,200tons CO2M illio n s1,000$200800$150$100Mean Annual Payments:$26.59m @ $2 tCO2$66.48m @ $5 tCO2$132.96m @ $10 tCO2600400$50$20200$--204020392038203720362035203420332032203120302029202820272026202520242023202220212020201920182017201620152014201320122011YearChapter E: Analysis of Financial Flows from REDD Activities In GuyanaRobert O'Sullivan <strong>and</strong> Agustin Silvani3