PDF - Eprints@CMFRI
PDF - Eprints@CMFRI
PDF - Eprints@CMFRI

You also want an ePaper? Increase the reach of your titles
YUMPU automatically turns print PDFs into web optimized ePapers that Google loves.
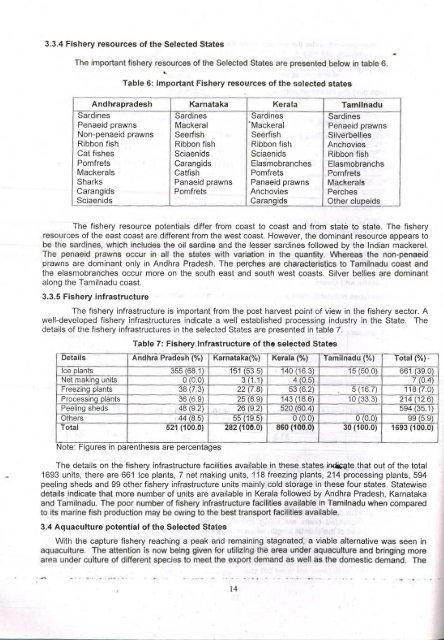
3.3.4 Fishery resources of the Selected StatesThe Importanl fishery resources of the Selected States are presented below in table 6.Table 6: Important Fishery reso~rces of the selected statesAndhrapradesh Karnataka Kerala TamilnaduSardines Sardines Sardines SardinesPenaeidprawns Mackeral "Mackeral Penaeid prawnsNon-penaeid prawns Seerfish Seerfish SilverbelliesRibbon fish Ribbon fish Ribbon fish AnchoviesCat fishes Sciaenids Sciaenids Ribbon fishPomfrets Carangids Elasmobranches ElasmobranchsMackerals Catfish Pomfrets PomfretsSharks Panaeid prawns Panaeid prawns MackeralsCarangids Pomfrets Anchovies PerchesSciaenids Carangids Other clupeidsThe fishery resource potentials differ from coast to coast and from state to state. The fisheryresouroes of the east coast are different from the west coast. However, the dominant resource appears tobe Ihe sardines, which includes the oil sardine and the lesser sardines followed by the Indian mackerel.The penaeid prawns occur in all the state with variation in the quanti y. Whereas the non-penaeidprawns are dominant only in Andhra Pradesh. The perches are characteristics to Tamilnadu coast andthe elasmobranches occur more on the south east and south west coasts. Silver bellies are dominantalong the Tamilnadu coast.3.3.5 Fishery infrastructureThe fishery infrastructure is important from the post harvest point of view in the fishery sector. Awell-developed fishery infrastructures indicate a well established processing industry in the State. Thedetails of the fishery infrastructures in the selected States are presented in table 7.Table 7: Fishery. Infrastructure of the selected StatesDetails Andhra Pradesh ('Yo) Karnataka('Yo) Kerala (%) Tamilmidu ('Yo) Total ('Yo).Ice plants 355 (68.1) 151 (53.5) 140 (16.3) 15(50.0) 661 (39.0)Net making units 0(0.0) 3 (1.1) 4 (0.5) 7 (0.4)Freezing plants 38 (7.3) 22 (7.8) 53 (6.2) 5 (16.7) 118 (7.0)!pj:Qcessing plants 36 (6.9) 25 (8.9) 143 (16.6) 10 (33.3) 214 (12.6)Peeling sheds 48 (9.2) 26 (9.2) 520 (60.4) 594 (35.1)Others 44(8.5) 55 (19.5) 0(0.0) 0(0.0) 99 (5.9)Total 521 (100.0) 282 (100.0) 660 (100.0) 30 (100.0) 1693 (100.0)Note: Figures In parenthesIs are percentagesThe details on the fishery infrastructure facilities available in these states ~Qte that out of the total1693 units, there are 661 Ice plants, 7 net making units, 118 freezing plants, 214 processing plants, 594peeling sheds and 99 other fishery infrastructure units mainly cold storage in these four states. Statewisedetails indicate that more number of units are available in Kerala followed by Andhra Pradesh, Karnatakaand Tamilnadu. fhe poor number of fishery lnfrastructure facilities available in TamUnadu when comparedto its marine fish productlon may be owing to the best fransport facilities avallab'le.3.4 Aquaculture potential of the Selected StatesWith the capture fishery reaching a peak and remaining stagnated, a viable alternative was seen inaquaculture. The attention is now baing given for utitizi 9 the area under aquaculture and bringing morearea under culture of different speCies. to nleet tne export dem.>.:lnd as well as the domestic demand. The