LEEKEE INDUSTRIES (M) SDN - teo seng capital berhad
LEEKEE INDUSTRIES (M) SDN - teo seng capital berhad
LEEKEE INDUSTRIES (M) SDN - teo seng capital berhad

You also want an ePaper? Increase the reach of your titles
YUMPU automatically turns print PDFs into web optimized ePapers that Google loves.
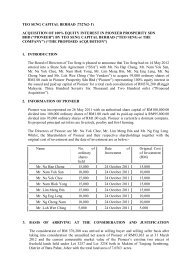
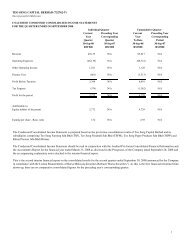
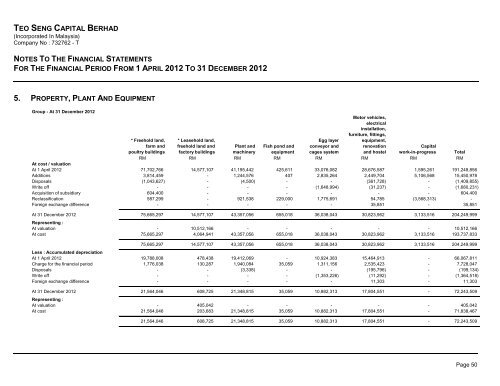
TEO SENG CAPITAL BERHAD(Incorporated In Malaysia)Company No : 732762 - TNOTES TO THE FINANCIAL STATEMENTSFOR THE FINANCIAL PERIOD FROM 1 APRIL 2012 TO 31 DECEMBER 20125. PROPERTY, PLANT AND EQUIPMENTGroup - At 31 December 2012Motor vehicles,electricalinstallation,furniture, fittings,* Freehold land, * Leasehold land, Egg layer equipment,farm and freehold land and Plant and Fish pond and conveyor and renovation Capitalpoultry buildings factory buildings machinery equipment cages system and hostel work-in-progress TotalRM RM RM RM RM RM RM RMAt cost / valuationAt 1 April 2012 71,702,766 14,577,107 41,195,442 425,611 33,076,082 28,676,587 1,595,261 191,248,856Additions 3,814,459 - 1,244,576 407 2,835,264 2,449,704 5,106,568 15,450,978Disposals (1,043,627) - (4,500) - - (361,728) - (1,409,855)Write off - - - - (1,648,994) (31,237) - (1,680,231)Acquisition of subsidiary 604,400 - - - - - - 604,400Reclassification 587,299 - 921,538 229,000 1,775,691 54,785 (3,568,313) -Foreign exchange difference - - - - - 35,851 - 35,851At 31 December 2012 75,665,297 14,577,107 43,357,056 655,018 36,038,043 30,823,962 3,133,516 204,249,999Representing :At valuation - 10,512,166 - - - - - 10,512,166At cost 75,665,297 4,064,941 43,357,056 655,018 36,038,043 30,823,962 3,133,516 193,737,83375,665,297 14,577,107 43,357,056 655,018 36,038,043 30,823,962 3,133,516 204,249,999Less : Accumulated depreciationAt 1 April 2012 19,788,008 478,438 19,412,069 - 10,924,383 15,464,913 - 66,067,811Charge for the financial period 1,776,038 130,287 1,940,084 35,059 1,311,156 2,535,423 - 7,728,047Disposals - - (3,338) - - (195,796) - (199,134)Write off - - - - (1,353,226) (11,292) - (1,364,518)Foreign exchange difference - - - - - 11,303 - 11,303At 31 December 2012 21,564,046 608,725 21,348,815 35,059 10,882,313 17,804,551 - 72,243,509Representing :At valuation - 405,042 - - - - - 405,042At cost 21,564,046 203,683 21,348,815 35,059 10,882,313 17,804,551 - 71,838,46721,564,046 608,725 21,348,815 35,059 10,882,313 17,804,551 - 72,243,509Page 50