Canadian Halal Meat Market Study - Agriculture and Rural ...
Canadian Halal Meat Market Study - Agriculture and Rural ...
Canadian Halal Meat Market Study - Agriculture and Rural ...

You also want an ePaper? Increase the reach of your titles
YUMPU automatically turns print PDFs into web optimized ePapers that Google loves.
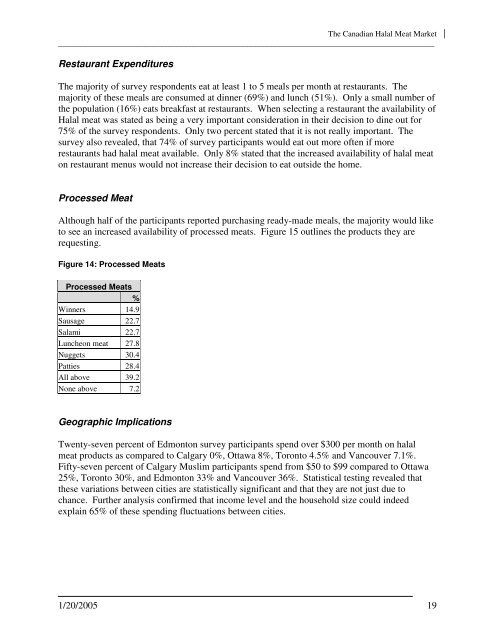
The <strong>Canadian</strong> <strong>Halal</strong> <strong>Meat</strong> <strong>Market</strong>_____________________________________________________________________________________________Restaurant ExpendituresThe majority of survey respondents eat at least 1 to 5 meals per month at restaurants. Themajority of these meals are consumed at dinner (69%) <strong>and</strong> lunch (51%). Only a small number ofthe population (16%) eats breakfast at restaurants. When selecting a restaurant the availability of<strong>Halal</strong> meat was stated as being a very important consideration in their decision to dine out for75% of the survey respondents. Only two percent stated that it is not really important. Thesurvey also revealed, that 74% of survey participants would eat out more often if morerestaurants had halal meat available. Only 8% stated that the increased availability of halal meaton restaurant menus would not increase their decision to eat outside the home.Processed <strong>Meat</strong>Although half of the participants reported purchasing ready-made meals, the majority would liketo see an increased availability of processed meats. Figure 15 outlines the products they arerequesting.Figure 14: Processed <strong>Meat</strong>sProcessed <strong>Meat</strong>s%Winners 14.9Sausage 22.7Salami 22.7Luncheon meat 27.8Nuggets 30.4Patties 28.4All above 39.2None above 7.2Geographic ImplicationsTwenty-seven percent of Edmonton survey participants spend over $300 per month on halalmeat products as compared to Calgary 0%, Ottawa 8%, Toronto 4.5% <strong>and</strong> Vancouver 7.1%.Fifty-seven percent of Calgary Muslim participants spend from $50 to $99 compared to Ottawa25%, Toronto 30%, <strong>and</strong> Edmonton 33% <strong>and</strong> Vancouver 36%. Statistical testing revealed thatthese variations between cities are statistically significant <strong>and</strong> that they are not just due tochance. Further analysis confirmed that income level <strong>and</strong> the household size could indeedexplain 65% of these spending fluctuations between cities.1/20/2005 19