A T EW C EAnalyzing the employed based on their willingness to change employment creates a profile of individualsinterested in changing from their current posion. The data shows that 21.5 percent of those who arecurrently employed within the Laborshed area indicated they are either “very likely” or “somewhat likely” tochange employers or employment if presented with the right job opportunity. Job sasfacon is the primaryreason that those who are currently employed are not willing to consider changing employment. A goodworking relaonship with current employer, age near rerement, wages, benefits, self‐employed, seniority,flexibility of work hours, job security, employment locaon close to home, family reasons, current hours/shis,a good working relaonship with current coworkers, lack of job opportunies, health issues and just started anew job are other reasons menoned but not as frequently.Total AdjustedLabor Force by ZoneFigure 11Totals by ZoneEstimated Total Willing toChange/Accept by Zone*Estimated Number ofEmployed Willing toChange by Zone*Zone 1 3,765 1,840 1,516Zone 2 8,616 3,624 2,988Zone 3 61,503 2,611 1,262Total 73,884 8,075 5,766*Total Willing to Change/Accept Employment references those who would be willing to commute into Zone 1 fromtheir home ZIP code for an employment opportunity.Figure 11 shows the employed willing to change employment residing throughout the survey zones.Respondents willing to change employment by zone are calculated using a logisc regression model weightedby mulple variables such as educaon level, gender, age, miles willing to travel and wages. This modelprovides an esmate for the total number of individuals “willing to change” by zone. The totals are based onthe Total Adjusted Labor Force esmates found in Figure 1.Slightly over one‐fourth (25.8%) of those who are employed, willing to change employment, are working twoor more jobs. This group would prefer to work full‐me hours for one employer versus working for mulpleemployers to accomplish full‐me employment. Those who are employed willing to change are currentlyworking an average of 46 hours per week. Over one‐tenth (13.4%) would consider employment offers thatrequire them to work more hours. Further analysis finds that 84.2 percent would prefer to work full‐meposions (35+ hrs./week), while 15.8 percent prefer posions with less than full‐me hours. Temporary andseasonal employment opportunies do not appeal to the majority of those who are currently employed andwilling to change employment. Seasonal employment would interest 32.8 percent, while 31.3 percent wouldconsider a temporary employment offer.When asked about their interest in entrepreneurship opportunies, 13.4 percent of the employed, that arewilling to change employment, expressed an interest in starng a business. The types of businesses they areprimarily interested in starng include trucking/logiscs (37.5%), automove repair/service (12.5%) andfarming (12.5%). However, the majority find access to capital/start‐up funds is the primary impediment ofoperang their own business venture followed by development of a business plan, concerns about theeconomy, finding a prime business locaon, insurance issues and risk involved.A G EThe gender breakdown of respondents willing to change employment is distributed 62.7 percent male and 37.3percent male. Figure 12 (on next page) compares the gender distribuon among the employed respondentswilling to change employment in each zone. These calculaons are based on the Esmated Number ofEmployed Willing to Change of 5,766 projecons found in Figure 11.<strong>Kossuth</strong> <strong>County</strong> Laborshed Analysis 10 Released March 2013
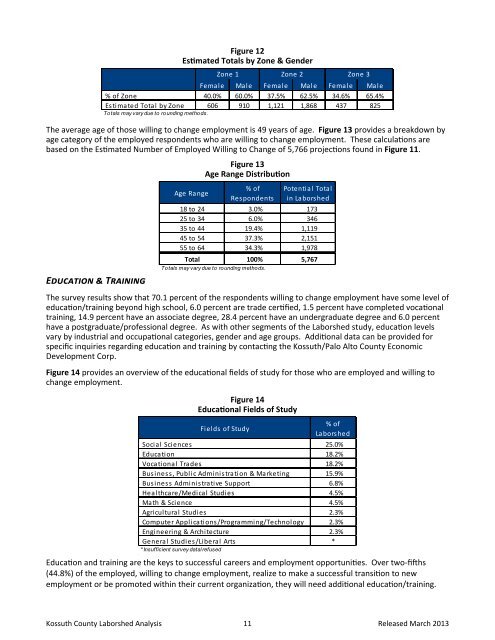
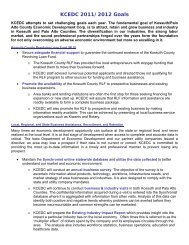
Figure 12Esmated Totals by Zone & GenderFemale Male Female Male Female Male% of Zone 40.0% 60.0% 37.5% 62.5% 34.6% 65.4%Estimated Total by Zone 606 910 1,121 1,868 437 825Totals may vary due to rounding methods.Zone 1 Zone 2 Zone 3The average age of those willing to change employment is 49 years of age. Figure 13 provides a breakdown byage category of the employed respondents who are willing to change employment. These calculaons arebased on the Esmated Number of Employed Willing to Change of 5,766 projecons found in Figure 11.E TAge RangeFigure 13Age Range DistribuonThe survey results show that 70.1 percent of the respondents willing to change employment have some level ofeducaon/training beyond high school, 6.0 percent are trade cerfied, 1.5 percent have completed vocaonaltraining, 14.9 percent have an associate degree, 28.4 percent have an undergraduate degree and 6.0 percenthave a postgraduate/professional degree. As with other segments of the Laborshed study, educaon levelsvary by industrial and occupaonal categories, gender and age groups. Addional data can be provided forspecific inquiries regarding educaon and training by contacng the <strong>Kossuth</strong>/Palo Alto <strong>County</strong> <strong>Economic</strong><strong>Development</strong> Corp.Figure 14 provides an overview of the educaonal fields of study for those who are employed and willing tochange employment.Fields of Study% ofRespondentsPotential Totalin Laborshed18 to 24 3.0% 17325 to 34 6.0% 34635 to 44 19.4% 1,11945 to 54 37.3% 2,15155 to 64 34.3% 1,978Total 100% 5,767Totals may vary due to rounding methods.Figure 14Educaonal Fields of Study% ofLaborshedSocial Sciences 25.0%Education 18.2%Vocational Trades 18.2%Business, Public Administration & Marketing 15.9%Business Administrative Support 6.8%Healthcare/Medical Studies 4.5%Math & Science 4.5%Agricultural Studies 2.3%Computer Applications/Programming/Technology 2.3%Engineering & Architecture 2.3%General Studies/Liberal Arts ** Insufficient survey data/refusedEducaon and training are the keys to successful careers and employment opportunies. Over two‐fihs(44.8%) of the employed, willing to change employment, realize to make a successful transion to newemployment or be promoted within their current organizaon, they will need addional educaon/training.<strong>Kossuth</strong> <strong>County</strong> Laborshed Analysis 11 Released March 2013