What's New in ENPEP-BALANCE Version 2.20 (pdf)
What's New in ENPEP-BALANCE Version 2.20 (pdf)
What's New in ENPEP-BALANCE Version 2.20 (pdf)

Create successful ePaper yourself
Turn your PDF publications into a flip-book with our unique Google optimized e-Paper software.
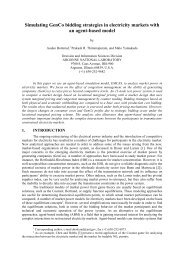
Center for Energy, Environmental, andEconomic Systems Analysis (CEEESA)Modifications and Enhancementsto <strong>ENPEP</strong> for W<strong>in</strong>dowsFor Upgrades from <strong>Version</strong> 2.15g to <strong>2.20</strong>System, Database, and File Management FeaturesFor <strong>ENPEP</strong> to work properly, the regional sett<strong>in</strong>gs on your computer must be set to English (UnitedStates) with a po<strong>in</strong>t as decimal symbol <strong>in</strong>stead of a comma. The regional sett<strong>in</strong>gs can be found <strong>in</strong>the W<strong>in</strong>dows Control Panel. <strong>ENPEP</strong> now checks the regional system sett<strong>in</strong>gs for the number anddate format, and issues a warn<strong>in</strong>g if yourcurrent sett<strong>in</strong>g is not set to English(United States).Dur<strong>in</strong>g the model <strong>in</strong>stallation, you nowhave the option of allocat<strong>in</strong>g a portion ofthe physical RAM to <strong>ENPEP</strong>. Typically,we recommend us<strong>in</strong>g about 50% of theactual RAM of your computer for <strong>ENPEP</strong>.Memory will be allocated only when youstart the <strong>BALANCE</strong> module and will bereleased when <strong>BALANCE</strong> is closed.Memory allocation reduces model runtimes – the more RAM you allocate, thefaster your case runs.<strong>ENPEP</strong> now has a new databasemanagement, backup, and recoveryrout<strong>in</strong>e. Instead of rely<strong>in</strong>g on only oneCreate a new(blank)databaseEach study isnow a databasefile on yourhard driveAdd an exist<strong>in</strong>gdatabase to thislistHere is the pathand name of thehighlighteddatabase filedatabase (enpepw<strong>in</strong>.db) as <strong>in</strong> earlier versions, version <strong>2.20</strong> now allows you to keep your cases <strong>in</strong>different databases. In fact, the databases replace the studies used <strong>in</strong> previous versions. Eachdatabase can be thought of as a study. Each database will be backed-up at regular <strong>in</strong>tervals set bythe user under “Run Parameters.” This design change significantly reduces data loss <strong>in</strong> case ofpower outages or system crashes.If you transition from 2.15 or an earlier version to <strong>2.20</strong> and you have more than one study <strong>in</strong> yourdatabase, please contact us for more detailed <strong>in</strong>structions.A new 30-day trial and evaluation version for <strong>ENPEP</strong> for W<strong>in</strong>dows <strong>2.20</strong> is now available. Pleasecontact us at ceeesa@anl.gov to request a CD.Interface FeaturesWe added icons <strong>in</strong> the toolbar for the execution of theup-down rout<strong>in</strong>e (determ<strong>in</strong>es the calculation sequencedur<strong>in</strong>g the simulation) and the actual <strong>BALANCE</strong>simulation.The two new icons change color to <strong>in</strong>dicate whetherchanges to the network structure or <strong>in</strong>put data mayrequire execut<strong>in</strong>g one or both of the rout<strong>in</strong>es.RUN UPDOWNChanges color:Black (status OK)Red (may need torun updown)Run <strong>BALANCE</strong>Changes color:Yellow (status OK)Red (may need torun <strong>BALANCE</strong>)LINK WIDTH DISPLAYActive only on sectorlevel; left icon foredit<strong>in</strong>g, right icon fordisplay<strong>ENPEP</strong> Modifications <strong>2.20</strong> Page 1
Model<strong>in</strong>g Algorithm and MethodologyWe have now implementedprice elasticities at the demandnodes. You can choose fromtwo price-demand relationships:l<strong>in</strong>ear and nonl<strong>in</strong>ear. An<strong>in</strong>teractive help feature quicklyillustrates how the elasticity youspecified will affect the modelresults.The economic cost calculation(NPV) is now fully <strong>in</strong>tegrated<strong>in</strong>to the model. Additional <strong>in</strong>putsto run the NPV calculations canbe found <strong>in</strong> the “RunParameters.” You need tospecify the discount rate to beClick<strong>in</strong>g the help buttonillustrates the tworelationships; the graphs<strong>in</strong> bold-red highlight theeffect of the elasticityentered by the userCenter for Energy, Environmental, andEconomic Systems Analysis (CEEESA)used when calculat<strong>in</strong>g the net present value of the total economic system costs as well as the costof energy (electricity) not served. Please contact us for more details and/or the manual for the NPVcalculations.Under Run Parameters, theuser specifies the discountrate and the cost of energy(electricity) not servedThe user can now specify ademand elasticity at eachdemand node; the user canchoose between a l<strong>in</strong>ear andnon-l<strong>in</strong>ear relationship;the elasticity can be changedevery yearThe Profit Factoraffects the pricecalculations <strong>in</strong>the ref<strong>in</strong>ery nodeWe <strong>in</strong>troduced a profit factor to the multiple output (ref<strong>in</strong>ery) nodes. Specify<strong>in</strong>g a profit factor willchange the prices of all process output products. Please consult the manual or the appropriatetra<strong>in</strong><strong>in</strong>g materials for more details on the price calculations.We removed some size limitations for network design. The model dimensions, i.e., the number ofnodes <strong>in</strong> the network, have been significantly <strong>in</strong>creased. Now, you can have up to 999 nodes ofeach node type <strong>in</strong> <strong>BALANCE</strong>, with the total number of l<strong>in</strong>ks be<strong>in</strong>g 999.<strong>New</strong> Report<strong>in</strong>g FeaturesWe added several new report<strong>in</strong>g features to the model.The first new report is the “Quick Report.” You will f<strong>in</strong>d this feature particularly useful dur<strong>in</strong>g the<strong>in</strong>itial case debugg<strong>in</strong>g and verification stage, because it allows you to quickly compare modelresults with historical statistics. You start the Quick Report by click<strong>in</strong>g on the sigma icon <strong>in</strong> the toolbar. To debug energy flows, please make sure you first select “Quantities” as l<strong>in</strong>k overlay. Thereport works the same for emission results. In this case, you must first select “Emission” as nodeoverlay. To use the feature to verify energy results, you click on <strong>in</strong>dividual network l<strong>in</strong>ks to <strong>in</strong>cludethem <strong>in</strong> the report. Selected l<strong>in</strong>ks are highlighted <strong>in</strong> red (click<strong>in</strong>g a l<strong>in</strong>k aga<strong>in</strong> will de-select it). Thereport w<strong>in</strong>dow shows the sum of energy flows on all selected l<strong>in</strong>ks for a given year. <strong>BALANCE</strong>automatically updates the value <strong>in</strong> the pop-up w<strong>in</strong>dow as l<strong>in</strong>ks are added to (subtracted from) the<strong>ENPEP</strong> Modifications <strong>2.20</strong> Page 2
Center for Energy, Environmental, andEconomic Systems Analysis (CEEESA)report. Click on “View Trend” to see a graph for the selected l<strong>in</strong>ks over the entire study period.Graph<strong>in</strong>g options <strong>in</strong>clude l<strong>in</strong>esand stacked bars (absolute and100%). You can also look at theresults <strong>in</strong> tabular format and evenexport the values to a text file forpost-process<strong>in</strong>g <strong>in</strong> Excel.Another new report type is theCustom Report. You will f<strong>in</strong>d thisfeature particularly useful for thef<strong>in</strong>al stages of your analysis orresult report<strong>in</strong>g, because it allowsyou to easily set up standardreports (f<strong>in</strong>al energy consumptionby sector or fuel type, primaryenergy supply, power sector fuelconsumption, emissions by sectoror fuel type, etc.). Custom Reports are similar to the Quick Reports. One difference is that CustoClick<strong>in</strong>g on View Trendshows a graph and tablefor the selected l<strong>in</strong>ks(highlighted <strong>in</strong> red)mReports are permanently stored <strong>in</strong> the database, while Quick Reports are temporary reports and notsaved anywhere unless you export the results to a text file. Also, Custom Reports are more flexible<strong>in</strong> the way you can configure them. You def<strong>in</strong>e the reports under “Edit – Custom Reports.” You startthe Custom Reports under “View – Custom Reports.” A pop-up w<strong>in</strong>dow appears that allows you toselect either an energy report, an emissions report by pollutant, or a cost report. If the report youwant to view spans more than one sector, the model opens all sectors that are part of this report,highlights the l<strong>in</strong>ks and shows the total for a given year. Click on “Trend” to see a graph for theentire study period. Graph<strong>in</strong>g options <strong>in</strong>clude l<strong>in</strong>es and stacked bars (absolute and 100%). You canalso look at the results <strong>in</strong> tabular format and export the values to a text file for post-process<strong>in</strong>g <strong>in</strong>Excel.You start theCustom Reportsus<strong>in</strong>g the menu(View - CustomReports)<strong>ENPEP</strong> Modifications <strong>2.20</strong> Page 3
Center for Energy, Environmental, andEconomic Systems Analysis (CEEESA)A new <strong>in</strong>terfacefeature allows youvisualize energyflows on the networkl<strong>in</strong>ks; that is, l<strong>in</strong>ksare displayed byus<strong>in</strong>g different l<strong>in</strong>kwidths. L<strong>in</strong>ks withlarge energy flowsare displayed withthick l<strong>in</strong>es, whilel<strong>in</strong>ks with small flowsare displayed withth<strong>in</strong> l<strong>in</strong>es. Thisfeature is designedto help you moreeasily verify modelresults and alsopresent graphical results.Click<strong>in</strong>g on View L<strong>in</strong>kWidths gives a quickvisual impression of theenergy flows <strong>in</strong> the sectorClick<strong>in</strong>g on EditL<strong>in</strong>k Widthsallows to modifythe l<strong>in</strong>k rangesWe substantially improved model error report<strong>in</strong>g. The number of errors reported has <strong>in</strong>creasednoticeably, and all errors are now clearly identified by sector, node, and error type. This allows youto more quicklyp<strong>in</strong>po<strong>in</strong>tpotentialproblems withthe networkconfiguration oryour model <strong>in</strong>put data.In connection with the improved error report<strong>in</strong>g, we expandedthe validity checks for all model <strong>in</strong>put data. Valid data rangesare now def<strong>in</strong>ed for all <strong>in</strong>put fields, and warn<strong>in</strong>gs are issued ifyou enter values that are outside the range. Also, <strong>in</strong> case youadd nodes to the network but forget to enter <strong>in</strong>put data,<strong>ENPEP</strong> now issues a listof the m<strong>in</strong>imum <strong>in</strong>put datathat are required toexecute the model.Code CorrectionsSeveral code corrections were made with regard to electric units, <strong>in</strong>put limitations, or valid data rangesfor <strong>in</strong>put fields, as well as the case import and export rout<strong>in</strong>es. Please contact us if you need moredetails on these corrections.<strong>ENPEP</strong> Modifications <strong>2.20</strong> Page 4