Findings for Foreign Equity Investment in Singapore 2011 - Statistics ...
Findings for Foreign Equity Investment in Singapore 2011 - Statistics ...
Findings for Foreign Equity Investment in Singapore 2011 - Statistics ...

Create successful ePaper yourself
Turn your PDF publications into a flip-book with our unique Google optimized e-Paper software.
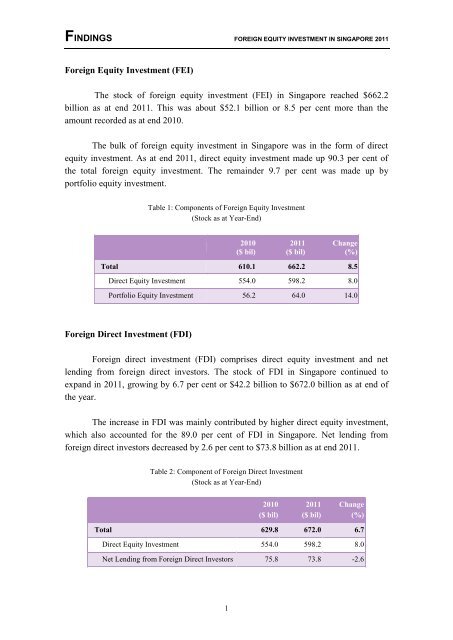
FINDINGS FOREIGN EQUITY INVESTMENT IN SINGAPORE <strong>2011</strong><strong>Foreign</strong> <strong>Equity</strong> <strong>Investment</strong> (FEI)The stock of <strong>for</strong>eign equity <strong>in</strong>vestment (FEI) <strong>in</strong> S<strong>in</strong>gapore reached $662.2billion as at end <strong>2011</strong>. This was about $52.1 billion or 8.5 per cent more than theamount recorded as at end 2010.The bulk of <strong>for</strong>eign equity <strong>in</strong>vestment <strong>in</strong> S<strong>in</strong>gapore was <strong>in</strong> the <strong>for</strong>m of directequity <strong>in</strong>vestment. As at end <strong>2011</strong>, direct equity <strong>in</strong>vestment made up 90.3 per cent ofthe total <strong>for</strong>eign equity <strong>in</strong>vestment. The rema<strong>in</strong>der 9.7 per cent was made up byportfolio equity <strong>in</strong>vestment.Table 1: Components of <strong>Foreign</strong> <strong>Equity</strong> <strong>Investment</strong>(Stock as at Year-End)2010($ bil)<strong>2011</strong>($ bil)Change(%)Total 610.1 662.2 8.5Direct <strong>Equity</strong> <strong>Investment</strong> 554.0 598.2 8.0Portfolio <strong>Equity</strong> <strong>Investment</strong> 56.2 64.0 14.0<strong>Foreign</strong> Direct <strong>Investment</strong> (FDI)<strong>Foreign</strong> direct <strong>in</strong>vestment (FDI) comprises direct equity <strong>in</strong>vestment and netlend<strong>in</strong>g from <strong>for</strong>eign direct <strong>in</strong>vestors. The stock of FDI <strong>in</strong> S<strong>in</strong>gapore cont<strong>in</strong>ued toexpand <strong>in</strong> <strong>2011</strong>, grow<strong>in</strong>g by 6.7 per cent or $42.2 billion to $672.0 billion as at end ofthe year.The <strong>in</strong>crease <strong>in</strong> FDI was ma<strong>in</strong>ly contributed by higher direct equity <strong>in</strong>vestment,which also accounted <strong>for</strong> the 89.0 per cent of FDI <strong>in</strong> S<strong>in</strong>gapore. Net lend<strong>in</strong>g from<strong>for</strong>eign direct <strong>in</strong>vestors decreased by 2.6 per cent to $73.8 billion as at end <strong>2011</strong>.Table 2: Component of <strong>Foreign</strong> Direct <strong>Investment</strong>(Stock as at Year-End)2010($ bil)<strong>2011</strong>($ bil)Change(%)Total 629.8 672.0 6.7Direct <strong>Equity</strong> <strong>Investment</strong> 554.0 598.2 8.0Net Lend<strong>in</strong>g from <strong>Foreign</strong> Direct Investors 75.8 73.8 -2.61
FINDINGS FOREIGN EQUITY INVESTMENT IN SINGAPORE <strong>2011</strong>Distribution by IndustryThe f<strong>in</strong>ancial & <strong>in</strong>surance services sector attracted the most FDI, followed bythe manufactur<strong>in</strong>g sector and wholesale & retail trade sector. Together, these threesectors accounted <strong>for</strong> more than four-fifths of FDI <strong>in</strong> S<strong>in</strong>gapore.Table 3: Distribution of FDI by Industry(Stock as at Year-End)Totalof which:Amount($ bil)2010 <strong>2011</strong>Share(%)Amount($ bil)Share(%)629.8 100.0 672.0 100.0F<strong>in</strong>ancial & Insurance Services 272.6 43.3 289.7 43.1Manufactur<strong>in</strong>g 133.7 21.2 137.3 20.4Wholesale & Retail Trade 108.9 17.3 118.5 17.6Professional, Scientific & Technical,Adm<strong>in</strong>istrative & Support Services35.8 5.7 39.8 5.9Transport & Storage 36.9 5.9 35.3 5.3Real Estate Activities 20.3 3.2 27.5 4.1F<strong>in</strong>ancial & Insurance ServicesAs at end <strong>2011</strong>, the stock of FDI <strong>in</strong> S<strong>in</strong>gapore’s f<strong>in</strong>ancial & <strong>in</strong>surance servicessector amounted to $289.7 billion. With<strong>in</strong> this sector, FDI was predom<strong>in</strong>antly <strong>in</strong><strong>in</strong>vestment hold<strong>in</strong>g ($242.9 billion), followed by banks ($14.7 billion) and <strong>in</strong>suranceservices ($9.4 billion).Table 4: FDI <strong>in</strong> F<strong>in</strong>ancial & Insurance Services Sector(Stock as at Year-End)2010($ bil)<strong>2011</strong>($ bil)Share <strong>in</strong> <strong>2011</strong>(%)F<strong>in</strong>ancial & Insurance Services 272.6 289.7 100.0<strong>Investment</strong> Hold<strong>in</strong>g 228.1 242.9 83.8Banks 14.4 14.7 5.1Insurance Services 8.6 9.4 3.32
FINDINGS FOREIGN EQUITY INVESTMENT IN SINGAPORE <strong>2011</strong>Geographical DistributionEurope and Asia rema<strong>in</strong>ed as the top sources of FDI <strong>in</strong> S<strong>in</strong>gapore. As at end<strong>2011</strong>, 37.5 per cent (or $252.0 billion) of total FDI was attributed to European <strong>in</strong>vestorswhile about 24.1 per cent (or $161.9 billion) was contributed by Asian <strong>in</strong>vestors. Theother major sources of <strong>in</strong>vestment were South & Central America & the Caribbean(21.8 per cent or $146.3 billion) and North America (12.1 per cent or $81.6 billion).Chart 1: Source of FDI by Region, <strong>2011</strong>NorthAmerica12.1%Africa2.2%Others2.3%Europe37.5%South &Central America& the Caribbean21.8%Asia24.1%EuropeEurope’s FDI stock <strong>in</strong> S<strong>in</strong>gapore rose by 8.6 per cent to $252.0 billion as at end<strong>2011</strong>. Major <strong>in</strong>vestors from this region <strong>in</strong>cluded Netherlands ($66.3 billion) and theUnited K<strong>in</strong>gdom ($55.9 billion). Direct <strong>in</strong>vestment from Netherlands waspredom<strong>in</strong>antly <strong>in</strong> manufactur<strong>in</strong>g and wholesale & retail trade sectors while British<strong>in</strong>vestors favoured the manufactur<strong>in</strong>g and f<strong>in</strong>ancial & <strong>in</strong>surance services sectors.4