userguide WIEN2WANNIER: From linearized augmented ... - WIEN 2k
userguide WIEN2WANNIER: From linearized augmented ... - WIEN 2k
userguide WIEN2WANNIER: From linearized augmented ... - WIEN 2k

Create successful ePaper yourself
Turn your PDF publications into a flip-book with our unique Google optimized e-Paper software.
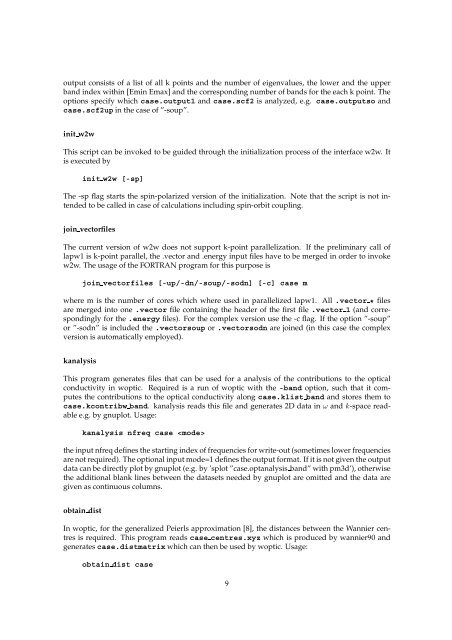
output consists of a list of all k points and the number of eigenvalues, the lower and the upperband index within [Emin Emax] and the corresponding number of bands for the each k point. Theoptions specify which case.output1 and case.scf2 is analyzed, e.g. case.outputso andcase.scf2up in the case of ”-soup”.init w2wThis script can be invoked to be guided through the initialization process of the interface w2w. Itis executed byinit w2w [-sp]The -sp flag starts the spin-polarized version of the initialization. Note that the script is not intendedto be called in case of calculations including spin-orbit coupling.join vectorfilesThe current version of w2w does not support k-point parallelization. If the preliminary call oflapw1 is k-point parallel, the .vector and .energy input files have to be merged in order to invokew2w. The usage of the FORTRAN program for this purpose isjoin vectorfiles [-up/-dn/-soup/-sodn] [-c] case mwhere m is the number of cores which where used in parallelized lapw1. All .vector * filesare merged into one .vector file containing the header of the first file .vector 1 (and correspondinglyfor the .energy files). For the complex version use the -c flag. If the option ”-soup”or ”-sodn” is included the .vectorsoup or .vectorsodn are joined (in this case the complexversion is automatically employed).kanalysisThis program generates files that can be used for a analysis of the contributions to the opticalconductivity in woptic. Required is a run of woptic with the -band option, such that it computesthe contributions to the optical conductivity along case.klist band and stores them tocase.kcontribw band. kanalysis reads this file and generates 2D data in ω and k-space readablee.g. by gnuplot. Usage:kanalysis nfreq case the input nfreq defines the starting index of frequencies for write-out (sometimes lower frequenciesare not required). The optional input mode=1 defines the output format. If it is not given the outputdata can be directly plot by gnuplot (e.g. by ’splot ”case.optanalysis band” with pm3d’), otherwisethe additional blank lines between the datasets needed by gnuplot are omitted and the data aregiven as continuous columns.obtain distIn woptic, for the generalized Peierls approximation [8], the distances between the Wannier centresis required. This program reads case centres.xyz which is produced by wannier90 andgenerates case.distmatrix which can then be used by woptic. Usage:obtain dist case9