Evaluation of the surveillance system for MAP infection in Swedish ...
Evaluation of the surveillance system for MAP infection in Swedish ...
Evaluation of the surveillance system for MAP infection in Swedish ...

Create successful ePaper yourself
Turn your PDF publications into a flip-book with our unique Google optimized e-Paper software.
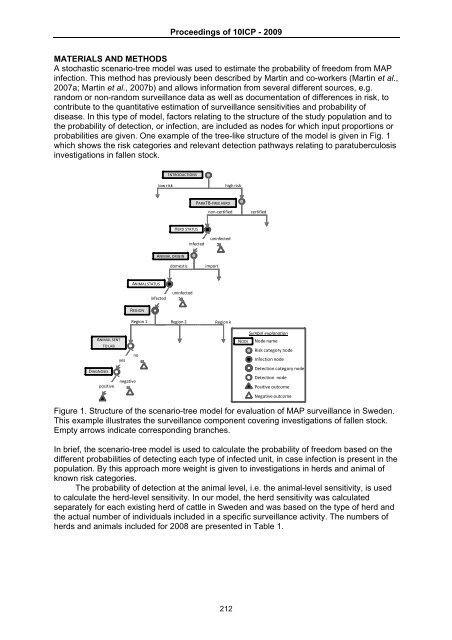
Proceed<strong>in</strong>gs <strong>of</strong> 10ICP - 2009MATERIALS AND METHODSA stochastic scenario-tree model was used to estimate <strong>the</strong> probability <strong>of</strong> freedom from <strong>MAP</strong><strong><strong>in</strong>fection</strong>. This method has previously been described by Mart<strong>in</strong> and co-workers (Mart<strong>in</strong> et al.,2007a; Mart<strong>in</strong> et al., 2007b) and allows <strong>in</strong><strong>for</strong>mation from several different sources, e.g.random or non-random <strong>surveillance</strong> data as well as documentation <strong>of</strong> differences <strong>in</strong> risk, tocontribute to <strong>the</strong> quantitative estimation <strong>of</strong> <strong>surveillance</strong> sensitivities and probability <strong>of</strong>disease. In this type <strong>of</strong> model, factors relat<strong>in</strong>g to <strong>the</strong> structure <strong>of</strong> <strong>the</strong> study population and to<strong>the</strong> probability <strong>of</strong> detection, or <strong><strong>in</strong>fection</strong>, are <strong>in</strong>cluded as nodes <strong>for</strong> which <strong>in</strong>put proportions orprobabilities are given. One example <strong>of</strong> <strong>the</strong> tree-like structure <strong>of</strong> <strong>the</strong> model is given <strong>in</strong> Fig. 1which shows <strong>the</strong> risk categories and relevant detection pathways relat<strong>in</strong>g to paratuberculosis<strong>in</strong>vestigations <strong>in</strong> fallen stock.INTRODUCTIONSlow riskhigh riskPARATB‐FREE HERDnon‐certifiedcertifiedHERD STATUS<strong>in</strong>fectedun<strong>in</strong>fectedANIMAL ORIGINdomesticimportANIMAL STATUS<strong>in</strong>fectedun<strong>in</strong>fectedREGIONRegion 1 Region 2 Region kANIMAL SENTTO LABnoyesDIAGNOSISnegativepositiveSymbol explanationNODE Node nameRisk category nodeInfection nodeDetection category nodeDetection nodePositive outcomeNegative outcomeFigure 1. Structure <strong>of</strong> <strong>the</strong> scenario-tree model <strong>for</strong> evaluation <strong>of</strong> <strong>MAP</strong> <strong>surveillance</strong> <strong>in</strong> Sweden.This example illustrates <strong>the</strong> <strong>surveillance</strong> component cover<strong>in</strong>g <strong>in</strong>vestigations <strong>of</strong> fallen stock.Empty arrows <strong>in</strong>dicate correspond<strong>in</strong>g branches.In brief, <strong>the</strong> scenario-tree model is used to calculate <strong>the</strong> probability <strong>of</strong> freedom based on <strong>the</strong>different probabilities <strong>of</strong> detect<strong>in</strong>g each type <strong>of</strong> <strong>in</strong>fected unit, <strong>in</strong> case <strong><strong>in</strong>fection</strong> is present <strong>in</strong> <strong>the</strong>population. By this approach more weight is given to <strong>in</strong>vestigations <strong>in</strong> herds and animal <strong>of</strong>known risk categories.The probability <strong>of</strong> detection at <strong>the</strong> animal level, i.e. <strong>the</strong> animal-level sensitivity, is usedto calculate <strong>the</strong> herd-level sensitivity. In our model, <strong>the</strong> herd sensitivity was calculatedseparately <strong>for</strong> each exist<strong>in</strong>g herd <strong>of</strong> cattle <strong>in</strong> Sweden and was based on <strong>the</strong> type <strong>of</strong> herd and<strong>the</strong> actual number <strong>of</strong> <strong>in</strong>dividuals <strong>in</strong>cluded <strong>in</strong> a specific <strong>surveillance</strong> activity. The numbers <strong>of</strong>herds and animals <strong>in</strong>cluded <strong>for</strong> 2008 are presented <strong>in</strong> Table 1.212