Annex <strong>II</strong>IStatus of ESB (59 per cent) account applications for all sectors, as at 19 September 2002Sector(In million U.S $)Total ofDistributionPlanApplicationsReceivedReceived vsAllocatedNotified/Approved by UNSecretariat Under Processing*GRL Non-Compliant/InactiveGRL Notice/GRLProcessingApproved byCommittee On Hold Returned HoldBlockNull/VoidValue No. Value % No. Value No. Value No. Value No. Value No. Value No. Value No. Value No.Humanitarian 39,373 19,119 39,466 100.24% 4,749 10,109 381 2,666 231 882.9 7 36.8 10,077 22,255 864 3,187 111 136.8 2,641Oil Spares 4,800 6,163 4,482 93.38% 1,537 1,288 248 374 124 119.8 5 5.2 3,178 2,071 421 553 48 62.5 584Grand Total 44,173 25,282 43,948 99.49% 6,286 11,397 629 3,040 355 1,002.0 12 42.0 13,255 24,326 1,285 3,740 159 199.3 3,22513 (percent) ShareofAllocationStatus of ESC (13 per cent) account applications for all phases, as at 19 September 2002FundsAllocatedto UN**Allocatedto Importsby UN(In million U.S $)Notified/Applications ReceivedApproved by UNSecretariat Under Processing*GRL Non-Compliant/InactiveGRL Notice/GRLProcessingApproved byCommittee On Hold Null/VoidTotalArrivedNo. Value No. Value No. Value No. Value No. Value No. Value No. Value No. ValueTotal 7,105 4,172 2,932 6,166 1,504 784 124 92 25 32 34.3 1 0.33 4,989 1,316 5 0.5 236 1,498Contracts Processing and Monitoring Division* Under Processing includes non-compliant and inactive applications** "Funds Allocated to UN" is the balance of funds allocated to UN agencies and programmes, after the deduction of the share of ESC (13 per cent) account for food,medicine/vaccines and oil spare parts which are procured under bulk-purchase arrangement by the Government of Iraq for the entire country.
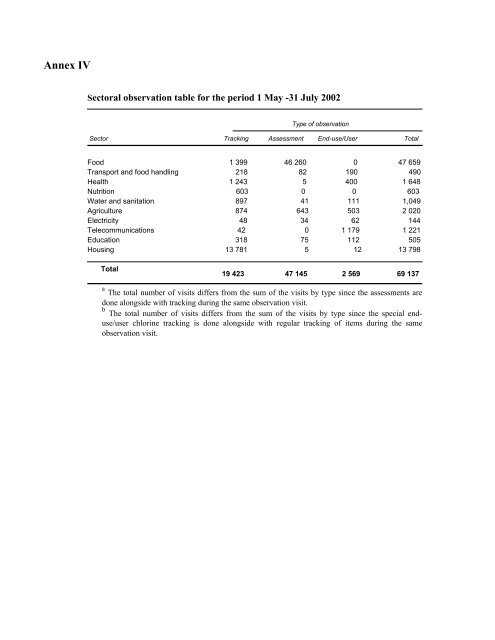
Annex IVSectoral observation table for the period 1 May -31 July 2002Type of observationSector Tracking Assessment End-use/User TotalFood 1 399 46 260 0 47 659Transport and food handling 218 82 190 490Health 1 243 5 400 1 648Nutrition 603 0 0 603Water and sanitation 897 41 111 1,049Agriculture 874 643 503 2 020Electricity 48 34 62 144Telecommunications 42 0 1 179 1 221Education 318 75 112 505Housing 13 781 5 12 13 798Total19 423 47 145 2 569 69 137a The total number of visits differs from the sum of the visits by type since the assessments aredone alongside with tracking during the same observation visit.b The total number of visits differs from the sum of the visits by type since the special enduse/userchlorine tracking is done alongside with regular tracking of items during the sameobservation visit.