BNZ - BusinessNZ Performance of Manufacturing Index (PMI).
BNZ - BusinessNZ Performance of Manufacturing Index (PMI).
BNZ - BusinessNZ Performance of Manufacturing Index (PMI).
- No tags were found...

You also want an ePaper? Increase the reach of your titles
YUMPU automatically turns print PDFs into web optimized ePapers that Google loves.
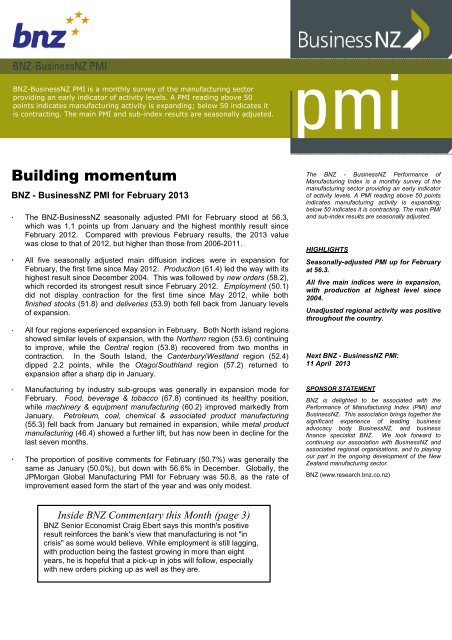
<strong>BNZ</strong>-<strong>BusinessNZ</strong> <strong>PMI</strong> is a monthly survey <strong>of</strong> the manufacturing sectorproviding an early indicator <strong>of</strong> activity levels. A <strong>PMI</strong> reading above 50points indicates manufacturing activity is expanding; below 50 indicates itis contracting. The main <strong>PMI</strong> and sub-index results are seasonally adjusted.Building momentum<strong>BNZ</strong> - <strong>BusinessNZ</strong> <strong>PMI</strong> for February 2013• The <strong>BNZ</strong>-<strong>BusinessNZ</strong> seasonally adjusted <strong>PMI</strong> for February stood at 56.3,which was 1.1 points up from January and the highest monthly result sinceFebruary 2012. Compared with previous February results, the 2013 valuewas close to that <strong>of</strong> 2012, but higher than those from 2006-2011.• All five seasonally adjusted main diffusion indices were in expansion forFebruary, the first time since May 2012. Production (61.4) led the way with itshighest result since December 2004. This was followed by new orders (58.2),which recorded its strongest result since February 2012. Employment (50.1)did not display contraction for the first time since May 2012, while bothfinished stocks (51.8) and deliveries (53.9) both fell back from January levels<strong>of</strong> expansion.• All four regions experienced expansion in February. Both North island regionsshowed similar levels <strong>of</strong> expansion, with the Northern region (53.6) continuingto improve, while the Central region (53.8) recovered from two months incontraction. In the South Island, the Canterbury/Westland region (52.4)dipped 2.2 points, while the Otago/Southland region (57.2) returned toexpansion after a sharp dip in January.• <strong>Manufacturing</strong> by industry sub-groups was generally in expansion mode forFebruary. Food, beverage & tobacco (67.8) continued its healthy position,while machinery & equipment manufacturing (60.2) improved markedly fromJanuary. Petroleum, coal, chemical & associated product manufacturing(55.3) fell back from January but remained in expansion, while metal productmanufacturing (46.4) showed a further lift, but has now been in decline for thelast seven months.• The proportion <strong>of</strong> positive comments for February (50.7%) was generally thesame as January (50.0%), but down with 56.6% in December. Globally, theJPMorgan Global <strong>Manufacturing</strong> <strong>PMI</strong> for February was 50.8, as the rate <strong>of</strong>improvement eased form the start <strong>of</strong> the year and was only modest.The <strong>BNZ</strong> - <strong>BusinessNZ</strong> <strong>Performance</strong> <strong>of</strong><strong>Manufacturing</strong> <strong>Index</strong> is a monthly survey <strong>of</strong> themanufacturing sector providing an early indicator<strong>of</strong> activity levels. A <strong>PMI</strong> reading above 50 pointsindicates manufacturing activity is expanding;below 50 indicates it is contracting. The main <strong>PMI</strong>and sub-index results are seasonally adjusted.HIGHLIGHTSSeasonally-adjusted <strong>PMI</strong> up for Februaryat 56.3.All five main indices were in expansion,with production at highest level since2004.Unadjusted regional activity was positivethroughout the country.Next <strong>BNZ</strong> - <strong>BusinessNZ</strong> <strong>PMI</strong>:11 April 2013SPONSOR STATEMENT<strong>BNZ</strong> is delighted to be associated with the<strong>Performance</strong> <strong>of</strong> <strong>Manufacturing</strong> <strong>Index</strong> (<strong>PMI</strong>) and<strong>BusinessNZ</strong>. This association brings together thesignificant experience <strong>of</strong> leading businessadvocacy body <strong>BusinessNZ</strong>, and businessfinance specialist <strong>BNZ</strong>. We look forward tocontinuing our association with <strong>BusinessNZ</strong> andassociated regional organisations, and to playingour part in the ongoing development <strong>of</strong> the NewZealand manufacturing sector.<strong>BNZ</strong> (www.research.bnz.co.nz)Inside <strong>BNZ</strong> Commentary this Month (page 3)<strong>BNZ</strong> Senior Economist Craig Ebert says this month's positiveresult reinforces the bank's view that manufacturing is not "incrisis" as some would believe. While employment is still lagging,with production being the fastest growing in more than eightyears, he is hopeful that a pick-up in jobs will follow, especiallywith new orders picking up as well as they are.
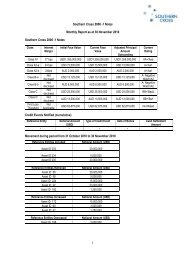
<strong>BNZ</strong>-<strong>BusinessNZ</strong> <strong>PMI</strong> is a monthly survey <strong>of</strong> the manufacturing sectorproviding an early indicator <strong>of</strong> activity levels. A <strong>PMI</strong> reading above 50points indicates manufacturing activity is expanding; below 50 indicates itis contracting. The main <strong>PMI</strong> and sub-index results are seasonally adjusted.February time series tablesNational <strong>Index</strong>es<strong>BNZ</strong> - <strong>BusinessNZ</strong> <strong>PMI</strong>(s.a.)Feb2008Feb2009Feb2010Feb2011Feb2012Feb201352.7 39.2 53.0 52.0 56.9 56.3Production (s.a.) 52.9 34.5 52.5 52.4 60.3 61.4Employment (s.a.) 48.4 39.4 50.8 52.8 50.4 50.1New Orders (s.a.) 55.3 39.8 56.3 52.4 62.0 58.2Finished Stocks (s.a.) 53.1 48.2 50.6 50.9 49.3 51.8Deliveries (s.a.) 53.8 41.7 53.7 50.8 53.9 53.9The <strong>BNZ</strong> - <strong>BusinessNZ</strong> <strong>PMI</strong> containsdata obtained through <strong>BusinessNZ</strong>’sregional organisations:Northern (Employers and ManufacturersAssociation - Northern): Northland, Auckland,Waikato, Bay <strong>of</strong> PlentyNational <strong>Index</strong>es<strong>BNZ</strong> - <strong>BusinessNZ</strong> <strong>PMI</strong>(s.a.)Feb2008Feb2009Feb2010Feb2011Feb2012Feb201352.7 39.2 53.0 52.0 56.9 56.3Northern 48.9 33.2 49.1 52.4 53.0 53.6Central 48.9 38.7 48.3 53.1 61.4 53.8Canterbury/Westland 57.0 41.5 59.2 42.0 52.0 52.4Otago/Southland 52.4 44.5 49.5 44.3 44.7 57.2Central (Business Central): Gisborne, Hawke’sBay, Taranaki, Manawatu, Wanganui, Wellington,Nelson, TasmanCanterbury/Westland (Canterbury EmployersChamber <strong>of</strong> Commerce): Canterbury,Marlborough, West Coast(s.a. denotes seasonally adjusted)Otago/Southland (Otago Southland EmployersAssociation): Otago, Southland.
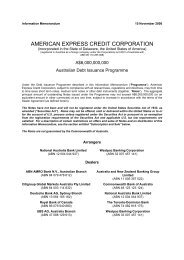
<strong>Manufacturing</strong>: There’s No Might About It February’s <strong>PMI</strong> strengthens to 56.3 Production, new orders, leading the way Just not spread around, while jobs flat Still, <strong>PMI</strong> positive regards Q1 manufacturing-GDP As drought impinges dairy processingDiffusion <strong>Index</strong>,seas. adj.7066625854<strong>Performance</strong> <strong>of</strong> <strong>Manufacturing</strong> <strong>Index</strong>Degree <strong>of</strong>expansionOrdersWe were pleased to see the further strengthening inFebruary’s <strong>Performance</strong> <strong>of</strong> <strong>Manufacturing</strong> <strong>Index</strong> (<strong>PMI</strong>).Not just because we’ve been going out <strong>of</strong> our way tohighlight the sector’s positives, when others have beendeclaring an industry-wide crisis (see our research note<strong>of</strong> a week ago, entitled “<strong>Manufacturing</strong> in Crisis!?!”).But for the very fact the latest <strong>PMI</strong>, up at 56.3, suggeststhe manufacturing industry is now expanding at a decentclip, albeit in a still-piebald fashion, and with jobs laggingfor the meantime.The headline numbers were certainly very encouraging.The summary <strong>PMI</strong> result – <strong>of</strong> a seasonally adjusted 56.2,following 55.2 in January – puts it comfortably above the52.3 average since inception (August 2002). One swallowdoesn’t make a summer. But two increase the chances.Momentum appeared even stronger when it came to theproduction component <strong>of</strong> the <strong>PMI</strong>. It leapt to 61.4 (for therecord, the fastest in more than eight years). The neworders component enlarged to 58.2, from 56.3. This isobviously a good pointer to ongoing production gains.This strength is all the more welcome, after the less-thanoverwhelmingdata we saw in last week’s Decemberquarter manufacturing survey. While its sales volumeswere up a good-looking 1.5%, inventories were s<strong>of</strong>t.The implications for non-food manufacturing productionwere slightly negative. Even adding in our estimates <strong>of</strong>booming food processing in the (pre-drought) Decemberquarter left us judging a 0.3% increase for manufacturingoutput in Q4 overall.A better result in Q1 manufacturing growth is givenpurpose by today’s <strong>PMI</strong>. However, its strength is notwithout a number <strong>of</strong> caveats.One is that the <strong>PMI</strong> momentum is not evenly spreadaround. Indeed, the gap between the best and worstperforming industries remains relatively high. The best(based on a three-month rolling average) was food50464238343026Nov-02 Aug-03 May-04 Feb-05 Nov-05 Aug-06 May-07 Feb-08 Nov-08 Aug-09 May-10 Feb-11 Nov-11 Aug-12Source: <strong>BNZ</strong> / Business NZBreakevenProductionDegree <strong>of</strong>contractionMonthlybeverage and tobacco manufacturing, with 66.0.This might, to some extent at least, reflect greater thannormal meat processing, on account <strong>of</strong> the drought,although the dry weather will, by the same token, becrimping the manufacture <strong>of</strong> dairy products.The other strong industry performers right now accordingto the latest <strong>PMI</strong> are non-metallic mineral products (61.6)and “other” manufacturing (61.6). But spare a thought forprinting publishing and recorded media (42.9), textileclothing and footwear (43.4) and metal productmanufacturing (44.0).It was also the case in February that only the very largest<strong>of</strong> firms were going for broke. Businesses employingmore than 100 staff registered a <strong>PMI</strong> <strong>of</strong> a whopping 76.3.Micro firms (1 to 10) were at 53.7, small-to-medium (11-50) at 51.0 while medium-to-large sized firms (51-100)were at 50.0.The other caveat to the latest <strong>PMI</strong> is that its reportedproduction increases, overall, are not translating intomore jobs (yet). February’s employment index, whileimproved at 50.1, only really stabilized, having beenbelow the breakeven mark <strong>of</strong> 50.0 for the prior 8 months.Nonetheless, we have to take today’s <strong>PMI</strong> asencouraging. It outlines that production is picking up,and will keep doing so if new orders are any guide.This, in due course, can be expected to drive a recoveryin employment. The way some people are talking, weshould be witnessing a very weak, to plunging, <strong>PMI</strong>.In fact, it’s improved to a more positive level.craig_ebert@bnz.co.nz
Contact Details<strong>BNZ</strong> ResearchStephen ToplisHead <strong>of</strong> Research+(64 4) 474 6905Craig EbertSenior Economist+(64 4) 474 6799Doug SteelEconomist+(64 4) 474 6923Mike JonesStrategist+(64 4) 924 7652Kymberly MartinStrategist+(64 4) 924 7654Main OfficesWellington60 Waterloo QuayPrivate Bag 39806Wellington Mail CentreLower Hutt 5045New ZealandPhone: +(64 4) 474 6145FI: 0800 283 269Fax: +(64 4) 474 6266Auckland80 Queen StreetPrivate Bag 92208Auckland 1142New ZealandPhone: +(64 9) 976 5762Toll Free: 0800 081 167Christchurch81 Riccarton RoadPO Box 1461Christchurch 8022New ZealandPhone: +(64 3) 353 2219Toll Free: 0800 854 854National Australia BankPeter JollyHead <strong>of</strong> Research+(61 2) 9237 1406Alan OsterGroup Chief Economist+(61 3) 8634 2927Rob HendersonChief Economist, Markets+(61 2) 9237 1836Ray AttrillGlobal Co-Head <strong>of</strong> FX Strategy+(61 2) 9237 1848WellingtonForeign Exchange +800 642 222Fixed Income/Derivatives +800 283 269SydneyForeign Exchange +800 9295 1100Fixed Income/Derivatives +(61 2) 9295 1166LondonForeign Exchange +800 333 00 333Fixed Income/Derivatives +(44 20) 7796 4761New YorkForeign Exchange +1 800 125 602Fixed Income/Derivatives +1877 377 5480Hong KongForeign Exchange +(85 2) 2526 5891Fixed Income/Derivatives +(85 2) 2526 589124 HOUR FOREIGN EXCHANGE SERVICEPhone Toll Free 6am to 10pm NZT – Wellington Office0800 739 707 10pm to 6am NZT – London Office – Sam HehirANALYST DISCLAIMER: The person or persons named as the author(s) <strong>of</strong> this report hereby certify that the views expressed in the research report accurately reflect their personal views about the subjectsecurities and issuers and other subject matters discussed. No part <strong>of</strong> their compensation was, is, or will be, directly or indirectly, related to the specific recommendations or views expressed in the researchreport. Research analysts responsible for this report receive compensation based upon, among other factors, the overall pr<strong>of</strong>itability <strong>of</strong> the Markets Division <strong>of</strong> National Australia Bank Limited, a member <strong>of</strong>the National Australia Bank Group (“NAB”). The views <strong>of</strong> the author(s) do not necessarily reflect the views <strong>of</strong> NAB and are subject to change without notice. NAB may receive fees for banking servicesprovided to an issuer <strong>of</strong> securities mentioned in this report. NAB, its affiliates and their respective <strong>of</strong>ficers, and employees, including persons involved in the preparation or issuance <strong>of</strong> this report (subject tothe policies <strong>of</strong> NAB), may also from time to time maintain a long or short position in, or purchase or sell a position in, hold or act as advisors, brokers or commercial bankers in relation to the securities (orrelated securities and financial instruments), <strong>of</strong> companies mentioned in this report. NAB or its affiliates may engage in these transactions in a manner that is inconsistent with or contrary to anyrecommendations made in this report.NEW ZEALAND DISCLAIMER: This publication has been provided for general information only. Although every effort has been made to ensure this publication is accurate the contents should not be reliedupon or used as a basis for entering into any products described in this publication. Bank <strong>of</strong> New Zealand strongly recommends readers seek independent legal/financial advice prior to acting in relation to any<strong>of</strong> the matters discussed in this publication. Neither Bank <strong>of</strong> New Zealand nor any person involved in this publication accepts any liability for any loss or damage whatsoever may directly or indirectly resultfrom any advice, opinion, information, representation or omission, whether negligent or otherwise, contained in this publication.USA DISCLAIMER: If this document is distributed in the United States, such distribution is by nabSecurities, LLC. This document is not intended as an <strong>of</strong>fer or solicitation for the purchase or sale <strong>of</strong> anysecurities, financial instrument or product or to provide financial services. It is not the intention <strong>of</strong> nabSecurities to create legal relations on the basis <strong>of</strong> information provided herein.National Australia Bank Limited is not a registered bank in New Zealand.