PDF version - the USGS
PDF version - the USGS
PDF version - the USGS
- No tags were found...

You also want an ePaper? Increase the reach of your titles
YUMPU automatically turns print PDFs into web optimized ePapers that Google loves.
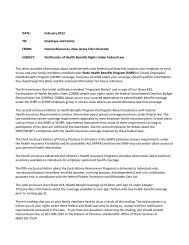
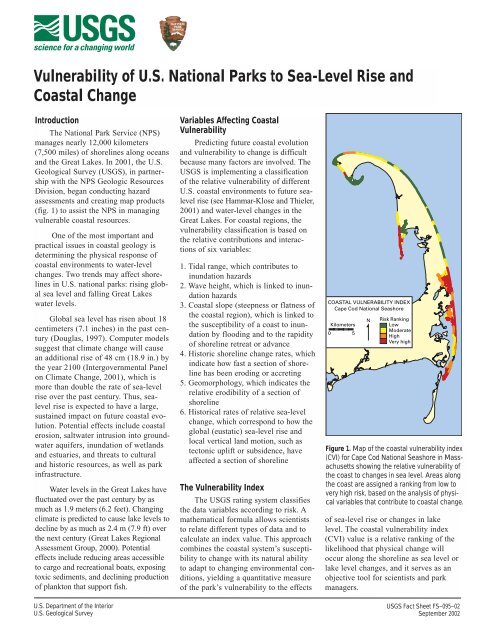
Vulnerability of U.S. National Parks to Sea-Level Rise andCoastal ChangeIntroductionThe National Park Service (NPS)manages nearly 12,000 kilometers(7,500 miles) of shorelines along oceansand <strong>the</strong> Great Lakes. In 2001, <strong>the</strong> U.S.Geological Survey (<strong>USGS</strong>), in partnershipwith <strong>the</strong> NPS Geologic ResourcesDivision, began conducting hazardassessments and creating map products(fig. 1) to assist <strong>the</strong> NPS in managingvulnerable coastal resources.One of <strong>the</strong> most important andpractical issues in coastal geology isdetermining <strong>the</strong> physical response ofcoastal environments to water-levelchanges. Two trends may affect shorelinesin U.S. national parks: rising globalsea level and falling Great Lakeswater levels.Global sea level has risen about 18centimeters (7.1 inches) in <strong>the</strong> past century(Douglas, 1997). Computer modelssuggest that climate change will causean additional rise of 48 cm (18.9 in.) by<strong>the</strong> year 2100 (Intergovernmental Panelon Climate Change, 2001), which ismore than double <strong>the</strong> rate of sea-levelrise over <strong>the</strong> past century. Thus, sealevelrise is expected to have a large,sustained impact on future coastal evolution.Potential effects include coastalerosion, saltwater intrusion into groundwateraquifers, inundation of wetlandsand estuaries, and threats to culturaland historic resources, as well as parkinfrastructure.Water levels in <strong>the</strong> Great Lakes havefluctuated over <strong>the</strong> past century by asmuch as 1.9 meters (6.2 feet). Changingclimate is predicted to cause lake levels todecline by as much as 2.4 m (7.9 ft) over<strong>the</strong> next century (Great Lakes RegionalAssessment Group, 2000). Potentialeffects include reducing areas accessibleto cargo and recreational boats, exposingtoxic sediments, and declining productionof plankton that support fish.Variables Affecting CoastalVulnerabilityPredicting future coastal evolutionand vulnerability to change is difficultbecause many factors are involved. The<strong>USGS</strong> is implementing a classificationof <strong>the</strong> relative vulnerability of differentU.S. coastal environments to future sealevelrise (see Hammar-Klose and Thieler,2001) and water-level changes in <strong>the</strong>Great Lakes. For coastal regions, <strong>the</strong>vulnerability classification is based on<strong>the</strong> relative contributions and interactionsof six variables:1. Tidal range, which contributes toinundation hazards2. Wave height, which is linked to inundationhazards3. Coastal slope (steepness or flatness of<strong>the</strong> coastal region), which is linked to<strong>the</strong> susceptibility of a coast to inundationby flooding and to <strong>the</strong> rapidityof shoreline retreat or advance4. Historic shoreline change rates, whichindicate how fast a section of shorelinehas been eroding or accreting5. Geomorphology, which indicates <strong>the</strong>relative erodibility of a section ofshoreline6. Historical rates of relative sea-levelchange, which correspond to how <strong>the</strong>global (eustatic) sea-level rise andlocal vertical land motion, such astectonic uplift or subsidence, haveaffected a section of shorelineThe Vulnerability IndexThe <strong>USGS</strong> rating system classifies<strong>the</strong> data variables according to risk. Ama<strong>the</strong>matical formula allows scientiststo relate different types of data and tocalculate an index value. This approachcombines <strong>the</strong> coastal system’s susceptibilityto change with its natural abilityto adapt to changing environmental conditions,yielding a quantitative measureof <strong>the</strong> park’s vulnerability to <strong>the</strong> effectsCOASTAL VULNERABILITY INDEXCape Cod National SeashoreKilometers0 5NRisk RankingLowModerateHighVery highFigure 1. Map of <strong>the</strong> coastal vulnerability index(CVI) for Cape Cod National Seashore in Massachusettsshowing <strong>the</strong> relative vulnerability of<strong>the</strong> coast to changes in sea level. Areas along<strong>the</strong> coast are assigned a ranking from low tovery high risk, based on <strong>the</strong> analysis of physicalvariables that contribute to coastal change.of sea-level rise or changes in lakelevel. The coastal vulnerability index(CVI) value is a relative ranking of <strong>the</strong>likelihood that physical change willoccur along <strong>the</strong> shoreline as sea level orlake level changes, and it serves as anobjective tool for scientists and parkmanagers.U.S. Department of <strong>the</strong> InteriorU.S. Geological Survey<strong>USGS</strong> Fact Sheet FS–095–02September 2002
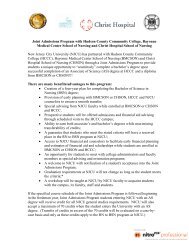
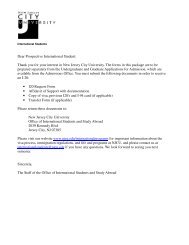
Figure 2. A narrow beach and eroded dunesresult from a recent winter storm at CoastGuard Beach, Cape Cod National Seashore,Mass. Photograph courtesy of <strong>the</strong> NationalPark Service.Assessment of NationalPark System UnitsPilot assessments have been completedfor Cape Cod National Seashorein Massachusetts, Gulf Islands NationalSeashore in Mississippi and Florida,and Olympic National Park in Washington.Preliminary results from <strong>the</strong> <strong>USGS</strong>investigations show important differencesin and among parks in terms of<strong>the</strong>ir vulnerability to coastal changedue to future sea-level rise. For example,Cape Cod National Seashore has avariable coastal landscape consisting ofhigh glacial bluffs, beaches, sand spits,and salt-marsh wetlands. The areasmost vulnerable to sea-level rise (fig. 1)have <strong>the</strong> lowest regional coastal slopes,geomorphologic types that are susceptibleto inundation, and <strong>the</strong> highest ratesof shoreline change (fig. 2). Areasbacked by glacial bluffs, comprisingmuch of <strong>the</strong> coast, have a CVI indicatinglow risk. Conversely, Gulf IslandsNational Seashore has large areas ofvery high risk, because it is almostentirely a low-lying barrier-island systemlocated on a low regional coastalslope (fig. 3).Some park areas that are at <strong>the</strong>greatest risk are also culturally significantor very popular. In Gulf IslandsNational Seashore, Civil War-era FortFigure 4. Kalaloch Lodge in Olympic NationalPark, Wash., is threatened by erosion. Longtermplans call for moving <strong>the</strong> lodge back from<strong>the</strong> cliff edge. Photograph by Erika Hammar-Klose, <strong>USGS</strong>.Massachusetts is at great risk becauseof high rates of erosion, <strong>the</strong> low-slopingcoastal plain, and <strong>the</strong> low-lying barrierisland morphology. In contrast, most ofCape Cod National Seashore’s infrastructureis located on high-elevationuplands away from <strong>the</strong> shore, and mosthigh-visitor-use areas are accessibleprimarily by foot.National Park Service staff areusing <strong>the</strong> CVI data for long-termresource management plans, park facilitiesplanning such as relocating coastalbuildings or roads, and assessing longtermthreats to cultural resources. Forexample, data from <strong>the</strong> Olympic NationalPark CVI study were used to identifyvulnerable infrastructure and implementplans to relocate <strong>the</strong> Kalaloch Lodge(fig. 4). The data are also being integratedinto <strong>the</strong> park’s general managementplan, <strong>the</strong> primary long-term planningdocument for <strong>the</strong> park. Future work forthis cooperative project between <strong>the</strong><strong>USGS</strong> and <strong>the</strong> NPS will map <strong>the</strong> coastalvulnerability index at additional parksthroughout <strong>the</strong> United States and U.S.territories.ReferencesDouglas, B.C., 1997, Global sea rise; Aredetermination: Surveys in Geophysics,v. 18, p. 279–292.Great Lakes Regional AssessmentGroup, 2000, Preparing for a changingclimate; The potential consequencesof climate variability andchange—Great Lakes overview(edited by P.J. Sousounis and J.M.Bisanz): Ann Arbor, MI, Universityof Michigan, 106 p.Hammar-Klose, E.S., and Thieler, E.R.,2001, Coastal vulnerability to sealevelrise: A preliminary databasefor <strong>the</strong> U.S. Atlantic, Pacific, andGulf of Mexico coasts: U.S. GeologicalSurvey Digital Data SeriesDDS–68, one CD-ROM (Availableonline athttp://pubs.usgs.gov/dds/dds68/)Intergovernmental Panel on ClimateChange, 2001, Climate change 2001;The scientific basis, contribution ofWorking Group I to <strong>the</strong> third assessmentreport of <strong>the</strong> IntergovernmentalPanel on Climate Change: Cambridge,England, Cambridge University Press,944 p. (Available online athttp://www.ipcc.ch/)For additional information, pleasecontact:E. Robert Thieler andS. Jeffress WilliamsU.S. Geological Survey384 Woods Hole RoadWoods Hole, MA 02543–1598E-mail: rthieler@usgs.govjwilliams@usgs.govTelephone: 508–548–8700Web: http://woodshole.er.usgs.gov/project-pages/nps-cvi/Rebecca BeaversNational Park ServiceNatural Resource Program CenterGeologic Resources DivisionP.O. Box 25287Denver, CO 80225–0287E-mail: Rebecca_Beavers@nps.govTelephone: 303–987–6945Figure 3. Most of <strong>the</strong> Gulf Islands National Seashore, Miss. and Fla., is composed of low-lying barrier islands. In many locations, you can seefrom <strong>the</strong> ocean to <strong>the</strong> sound, as shown above. A combination of variables makes this seashore highly vulnerable to predicted sea-level rise.Photograph by Erika Hammar-Klose, <strong>USGS</strong>.