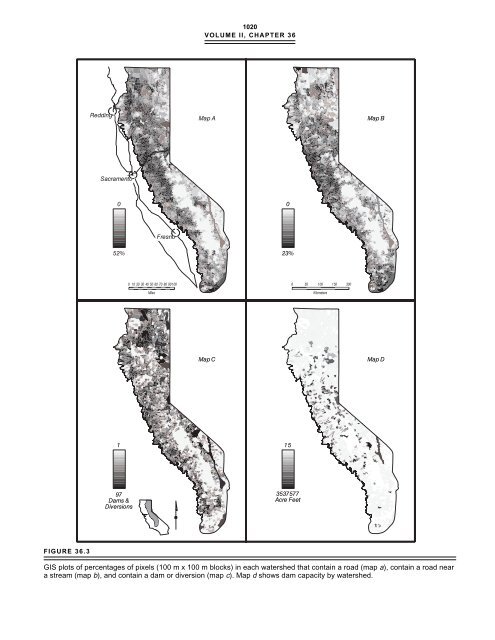
1020VOLUME II, CHAPTER 36FIGURE 36.3GIS plots of percentages of pixels (100 m x 100 m blocks) in each watershed that contain a road (map a), contain a road neara stream (map b), and contain a dam or diversion (map c). Map d shows dam capacity by watershed.
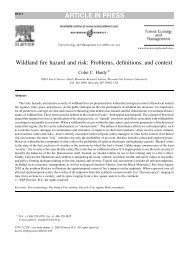
1021Status of Riparian HabitatFIGURE 36.4Effects of hydroelectric damsand diversions on riparianvegetation.GIS ANALYSIS OF ROADINFLUENCE ON STREAMSAn indication of the pervasiveness of road influence on <strong>Sierra</strong>nrivers and streams is provided by the GIS analysis of 100m by 100 m pixels in 141 watersheds (Calwater HydrologicSubareas). In each watershed, the percentage of pixels with aroad ranged from less than 0.6% <strong>to</strong> 31%, and the percentagewith a stream ranged from 4% <strong>to</strong> 19% (figure 36.5). The resultsfor roads are displayed for each watershed in figure36.3a. When these patterns are overlaid, the more interestingresult is obtained: the percentage of pixels with a stream thatalso contain a road, which we designate here as the Road InfluenceIndex (RII) (figure 36.3b) The RII is a measure of thepercentage of stream length with a road within 100 m. TheRII ranges from 2% <strong>to</strong> 33%, with a median value of 14.1%(figure 36.5). The central 50% of the distribution (i.e., the 71watersheds that fall in the center of the RII) have RII valuesbetween 10.8 and 17.4, and the central 80% have RII valuesbetween 8.7 and 21.3 (figure 36.5). Thus, in the vast majority(80%) of <strong>Sierra</strong> Nevada watersheds, 8% <strong>to</strong> 21% of streamreaches are potentially influenced by a road within 100 m.Additional detail, including values for this index, for thirty-three watersheds in the Eldorado National <strong>Forest</strong> is given inCostick 1996. He refers <strong>to</strong> this index as the percentage ofroaded area inside a 100 m stream buffer.The RIIs for watersheds in the northern <strong>Sierra</strong> Nevada(north of Interstate 80) are lower (median value 10) than thosefor watersheds in the central (median value 14), southern(median value 14), and eastern (median value 16) <strong>Sierra</strong> Nevada(figure 36.6).The true values of RII are certainly higher than indicatedhere because the data sets used for roads were derived in largepart from road maps, which do not show all roads. The <strong>to</strong>talstream length would also be greater if smaller-scale maps (e.g.,1:24,000) were used <strong>to</strong> identify streams, as only larger streamsare shown on the 1:100,000 scale maps.Aerial Pho<strong>to</strong>graph and Map Analysis of Gapsin Riparian CorridorsOf the 130 Calwater Super-Planning Watersheds selected forassessment by aerial pho<strong>to</strong>graphy, 121 displayed obvious gapsin the riparian corridor. These gaps were caused primarily byroad and railroad crossings, timber harvesting, clearing ofprivate lots, dewatering by diversions and dams, andgrazing.
- Page 1 and 2: G. MATHIAS KONDOLFDepartment of Lan
- Page 4 and 5: 1012VOLUME II, CHAPTER 36TABLE 36.1
- Page 6 and 7: 1014VOLUME II, CHAPTER 36TABLE 36.3
- Page 8 and 9: 1016VOLUME II, CHAPTER 36Elevation
- Page 10 and 11: 1018VOLUME II, CHAPTER 36FIGURE 36.
- Page 14 and 15: 1022VOLUME II, CHAPTER 36Frequency
- Page 16 and 17: 1024VOLUME II, CHAPTER 36conditions
- Page 18 and 19: 1026VOLUME II, CHAPTER 36we can inf
- Page 20 and 21: 1028VOLUME II, CHAPTER 36Hicks, T.
- Page 22: 1030VOLUME II, CHAPTER 36Schimer, F