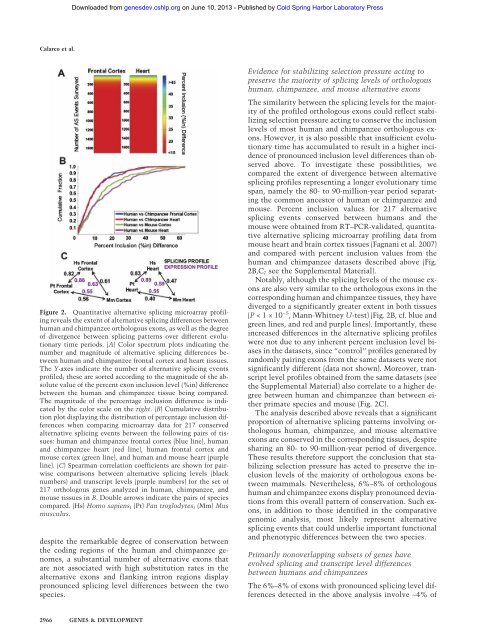
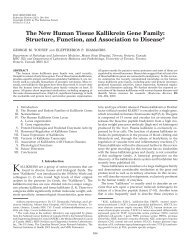
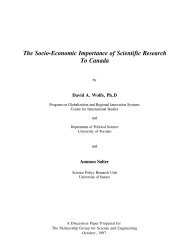
Downloaded from genesdev.cshlp.org on June 10, 2013 - Published by Cold Spring Harbor Laboratory Press<strong>C<strong>al</strong>arco</strong> <strong>et</strong> <strong>al</strong>.Figure 2. Quantitative <strong>al</strong>ternative splicing microarray pr<strong>of</strong>ilingreve<strong>al</strong>s the extent <strong>of</strong> <strong>al</strong>ternative splicing differences b<strong>et</strong>weenhuman and chimpanzee orthologous exons, as well as the degree<strong>of</strong> divergence b<strong>et</strong>ween splicing patterns over different evolutionarytime periods. (A) Color spectrum plots indicating thenumber and magnitude <strong>of</strong> <strong>al</strong>ternative splicing differences b<strong>et</strong>weenhuman and chimpanzee front<strong>al</strong> cortex and heart tissues.The Y-axes indicate the number <strong>of</strong> <strong>al</strong>ternative splicing eventspr<strong>of</strong>iled; these are sorted according to the magnitude <strong>of</strong> the absolutev<strong>al</strong>ue <strong>of</strong> the percent exon inclusion level (%in) differenceb<strong>et</strong>ween the human and chimpanzee tissue being compared.The magnitude <strong>of</strong> the percentage inclusion difference is indicatedby the color sc<strong>al</strong>e on the right. (B) Cumulative distributionplot displaying the distribution <strong>of</strong> percentage inclusion differenceswhen comparing microarray data for 217 conserved<strong>al</strong>ternative splicing events b<strong>et</strong>ween the following pairs <strong>of</strong> tissues:human and chimpanzee front<strong>al</strong> cortex (blue line), humanand chimpanzee heart (red line), human front<strong>al</strong> cortex andmouse cortex (green line), and human and mouse heart (purpleline). (C) Spearman correlation coefficients are shown for pairwisecomparisons b<strong>et</strong>ween <strong>al</strong>ternative splicing levels (blacknumbers) and transcript levels (purple numbers) for the s<strong>et</strong> <strong>of</strong>217 orthologous genes an<strong>al</strong>yzed in human, chimpanzee, andmouse tissues in B. Double arrows indicate the pairs <strong>of</strong> speciescompared. (Hs) Homo sapiens; (Pt) Pan troglodytes; (Mm) Musmusculus.despite the remarkable degree <strong>of</strong> conservation b<strong>et</strong>weenthe coding regions <strong>of</strong> the human and chimpanzee genomes,a substanti<strong>al</strong> number <strong>of</strong> <strong>al</strong>ternative exons thatare not associated with high substitution rates in the<strong>al</strong>ternative exons and flanking intron regions displaypronounced splicing level differences b<strong>et</strong>ween the twospecies.Evidence for stabilizing selection pressure acting topreserve the majority <strong>of</strong> splicing levels <strong>of</strong> orthologoushuman, chimpanzee, and mouse <strong>al</strong>ternative exonsThe similarity b<strong>et</strong>ween the splicing levels for the majority<strong>of</strong> the pr<strong>of</strong>iled orthologous exons could reflect stabilizingselection pressure acting to conserve the inclusionlevels <strong>of</strong> most human and chimpanzee orthologous exons.However, it is <strong>al</strong>so possible that insufficient evolutionarytime has accumulated to result in a higher incidence<strong>of</strong> pronounced inclusion level differences than observedabove. To investigate these possibilities, wecompared the extent <strong>of</strong> divergence b<strong>et</strong>ween <strong>al</strong>ternativesplicing pr<strong>of</strong>iles representing a longer evolutionary timespan, namely the 80- to 90-million-year period separatingthe common ancestor <strong>of</strong> human or chimpanzee andmouse. Percent inclusion v<strong>al</strong>ues for 217 <strong>al</strong>ternativesplicing events conserved b<strong>et</strong>ween humans and themouse were obtained from RT–PCR-v<strong>al</strong>idated, quantitative<strong>al</strong>ternative splicing microarray pr<strong>of</strong>iling data frommouse heart and brain cortex tissues (Fagnani <strong>et</strong> <strong>al</strong>. <strong>2007</strong>)and compared with percent inclusion v<strong>al</strong>ues from thehuman and chimpanzee datas<strong>et</strong>s described above (Fig.2B,C; see the Supplement<strong>al</strong> Materi<strong>al</strong>).Notably, <strong>al</strong>though the splicing levels <strong>of</strong> the mouse exonsare <strong>al</strong>so very similar to the orthologous exons in thecorresponding human and chimpanzee tissues, they havediverged to a significantly greater extent in both tissues(P
Downloaded from genesdev.cshlp.org on June 10, 2013 - Published by Cold Spring Harbor Laboratory PressSurveying primate <strong>al</strong>ternative splicingTable 1. Genes associated with different cellular functions with experiment<strong>al</strong>ly v<strong>al</strong>idated splicing level differences b<strong>et</strong>weenhumans and chimpanzeesFunction<strong>al</strong> category Gene name GO processes/known featuresAlternativesplicing-<strong>al</strong>teredprotein domain(s)Sign<strong>al</strong>ingInositol hexaphosphate kinaseInositol trisphosphate-3 kinaseIHPK2 (IHPK2)activityHypoth<strong>et</strong>ic<strong>al</strong> protein LOC220686 Phoshpatidylinositol-4 kinase activity PI4KADP-ribosylation factor-like 3 (ARL3) G-protein-coupled receptor protein GTPasesign<strong>al</strong>ing pathwayGene regulation TBP-associated factor 6 (TAF6) TFIID complex, regulator <strong>of</strong>NotranscriptionSRp40 (SFRS5) Splicing regulation RRM, RSPoly(A)-binding protein cytoplasmic 4 RNA binding, poly(A) bindingND(PABPC4)Immune response Toll/Interleukin-1 receptor 8 (TIR8) Immune response NDHerpesvirus entry mediator (HVEM/ Immune responseTM, cytoplasmicTNFRSF14)OtherGlutathione S-transferase omega Glutathione transferase activity, ND2 (GSTO2)m<strong>et</strong>abolism <strong>of</strong> xenobioticsRoundabout 1 homolog (ROBO1) Axon guidance, dyslexia candidate NDgeneFSHD region gene 1 (FRG1)Facioscapulohumor<strong>al</strong> diseaseActin cross-linkingcandidate-Adducin (ADD3)C<strong>al</strong>modulin binding, structur<strong>al</strong>Spectrin bindingconstituent <strong>of</strong> cytoskel<strong>et</strong>onZonula Occludens protein (ZO-1) Tight junction protein NDBridging Integrator 1 (BIN1) Regulation <strong>of</strong> endocytosis BARC<strong>al</strong>bindin 2 (CALB2) C<strong>al</strong>cium ion binding EF handChr. 14 ORF 153 Uncharacterized NDUnc-84 homolog (UNC84B)Microtubule binding, mitotic spindleorganization, and biogenesisNDFunction<strong>al</strong> annotations from the Gene Ontology database or from literature searches are listed. Protein domains predicted to be <strong>al</strong>teredby differenti<strong>al</strong> <strong>al</strong>ternative splicing are <strong>al</strong>so listed. In most cases, differenti<strong>al</strong> <strong>al</strong>ternative splicing was d<strong>et</strong>ected in both front<strong>al</strong> cortex andheart; exceptions are in IHPK2, front<strong>al</strong> cortex only; BIN1, front<strong>al</strong> cortex only; CALB2, heart only; and UNC84B, heart only. (IHPK)Inositol hexaphosphate kinase domain; (PI4K) phosphatidylinositol-4 kinase domain; (GTPase) Ras-like GTPase domain; (RRM) RNArecognition motif; (RS), arginine/serine-rich domain; (TM) transmembrane domain; (Cytoplasmic) cytoplasmic sign<strong>al</strong>ing domain;(Actin cross-linking) actin cross-linking protein fold; (Spectrin binding) C-termin<strong>al</strong> region <strong>of</strong> DD3 proxim<strong>al</strong> to a defined spectrininteractingdomain; (BAR) BIN/amphiphysin/Rvs domain involved in endocytosis; (EF hand) c<strong>al</strong>cium-binding domain; (ND) no knowndomain is affected by <strong>al</strong>ternative splicing.the microarray pr<strong>of</strong>iled genes. A comparable proportion<strong>of</strong> orthologous genes has been found to display at leasttw<strong>of</strong>old transcript level differences b<strong>et</strong>ween correspondinghuman and chimpanzee tissues (Preuss <strong>et</strong> <strong>al</strong>. 2004;Khaitovich <strong>et</strong> <strong>al</strong>. 2005). Remarkably, however, despite apar<strong>al</strong>lel divergence in <strong>al</strong>ternative splicing and transcription<strong>al</strong>patterns during the evolution <strong>of</strong> humans andchimpanzees, primarily nonoverlapping subs<strong>et</strong>s <strong>of</strong> genesare associated with these changes (Fig. 3). By sortinggenes according to the magnitude <strong>of</strong> the microarray-d<strong>et</strong>ectedpercent inclusion <strong>al</strong>ternative splicing level differences(Fig. 3, columns 1 and 3), it is evident that relativelyfew genes display coincident changes in transcription<strong>al</strong>levels (Fig. 3 in cf. columns 1 and 2, and columns3 and 4). Among the 160–240 splicing events with predictedpercent inclusion differences >20% in front<strong>al</strong> cortexand/or heart tissues, only 25% are predicted to <strong>al</strong>sohave tw<strong>of</strong>old or greater steady-state transcript levelchanges. This observation extends previous results indicatingthat predominantly different subs<strong>et</strong>s <strong>of</strong> genes areregulated in a cell-specific/tissue-specific or activity-dependentmanner at the transcription<strong>al</strong> and <strong>al</strong>ternativesplicing levels (Le <strong>et</strong> <strong>al</strong>. 2004; Pan <strong>et</strong> <strong>al</strong>. 2004; Li <strong>et</strong> <strong>al</strong>.2006; Fagnani <strong>et</strong> <strong>al</strong>. <strong>2007</strong>; Ip <strong>et</strong> <strong>al</strong>. <strong>2007</strong>). In particular, thepresent results show that these two layers <strong>of</strong> regulationhave evolved rapidly to affect different subs<strong>et</strong>s <strong>of</strong> genes,and indicate that <strong>al</strong>ternative splicing has served as anaddition<strong>al</strong> mechanism for diversifying gene regulationduring the 5–7 million years <strong>of</strong> evolution separating humansand chimpanzees.Alternative splicing differences b<strong>et</strong>ween humans andchimpanzees affect transcripts from genes associatedwith diverse cellular functionsGenes with <strong>al</strong>ternative splicing differences b<strong>et</strong>ween humansand chimpanzees d<strong>et</strong>ected using the m<strong>et</strong>hods describedabove, and confirmed by the RT–PCR assays, areassociated with diverse biologic<strong>al</strong> processes includinggene expression, sign<strong>al</strong>ing pathways, immune defense,GENES & DEVELOPMENT 2967