Outline Introduction Introduction Environmental Science Historical ...
Outline Introduction Introduction Environmental Science Historical ...
Outline Introduction Introduction Environmental Science Historical ...
- No tags were found...
Create successful ePaper yourself
Turn your PDF publications into a flip-book with our unique Google optimized e-Paper software.
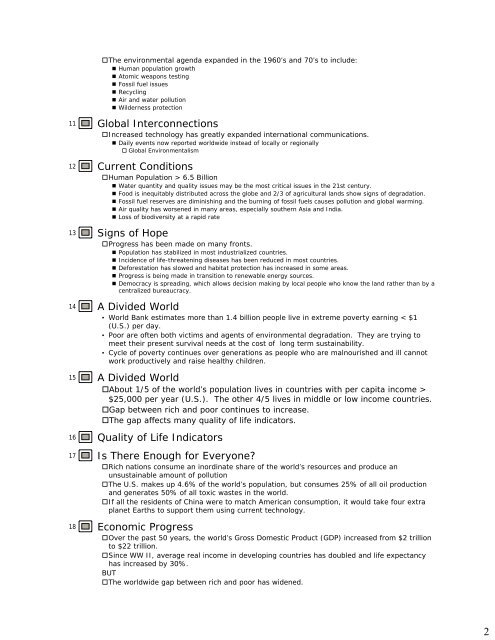
The environmental agenda expanded in the 1960’s and 70’s to include:• Human population growth• Atomic weapons testing• Fossil fuel issues• Recycling• Air and water pollution• Wilderness protection11 Global InterconnectionsIncreased technology has greatly expanded international communications.• Daily events now reported worldwide instead of locally or regionally Global <strong>Environmental</strong>ism12 Current ConditionsHuman Population > 6.5 Billion• Water quantity and quality issues may be the most critical issues in the 21st century.• Food is inequitably distributed across the globe and 2/3 of agricultural lands show signs of degradation.• Fossil fuel reserves are diminishing and the burning of fossil fuels causes pollution and global warming.• Air quality has worsened in many areas, especially southern Asia and India.• Loss of biodiversity at a rapid rate13 Signs of HopeProgress has been made on many fronts.• Population has stabilized in most industrialized countries.• Incidence of life-threatening diseases has been reduced in most countries.• Deforestation has slowed and habitat protection has increased in some areas.• Progress is being made in transition to renewable energy sources.• Democracy is spreading, which allows decision making by local people who know the land rather than by acentralized bureaucracy.14 A Divided World• World Bank estimates more than 1.4 billion people live in extreme poverty earning < $1(U.S.) per day.• Poor are often both victims and agents of environmental degradation. They are trying tomeet their present survival needs at the cost of long term sustainability.• Cycle of poverty continues over generations as people who are malnourished and ill cannotwork productively and raise healthy children.15 A Divided WorldAbout 1/5 of the world’s population lives in countries with per capita income >$25,000 per year (U.S.). The other 4/5 lives in middle or low income countries.Gap between rich and poor continues to increase.The gap affects many quality of life indicators.16 Quality of Life Indicators17 Is There Enough for Everyone?Rich nations consume an inordinate share of the world’s resources and produce anunsustainable amount of pollutionThe U.S. makes up 4.6% of the world’s population, but consumes 25% of all oil productionand generates 50% of all toxic wastes in the world.If all the residents of China were to match American consumption, it would take four extraplanet Earths to support them using current technology.18 Economic ProgressOver the past 50 years, the world’s Gross Domestic Product (GDP) increased from $2 trillionto $22 trillion.Since WW II, average real income in developing countries has doubled and life expectancyhas increased by 30%.BUTThe worldwide gap between rich and poor has widened.2


