View Annual Review - IAESTE
View Annual Review - IAESTE
View Annual Review - IAESTE
- No tags were found...

Create successful ePaper yourself
Turn your PDF publications into a flip-book with our unique Google optimized e-Paper software.
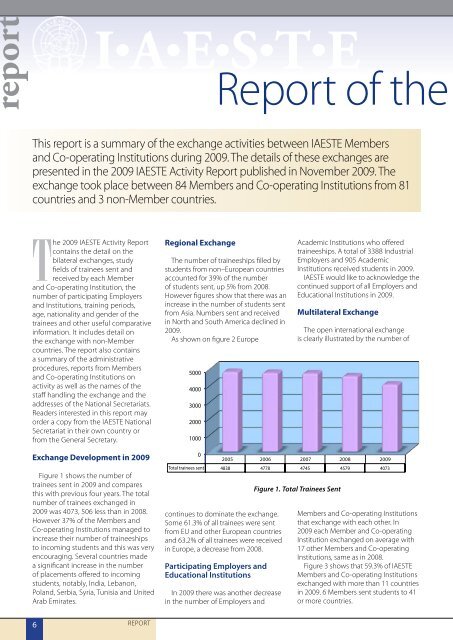
eportI • A • E • S • T • EReport of theThis report is a summary of the exchange activities between <strong>IAESTE</strong> Membersand Co-operating Institutions during 2009. The details of these exchanges arepresented in the 2009 <strong>IAESTE</strong> Activity Report published in November 2009. Theexchange took place between 84 Members and Co-operating Institutions from 81countries and 3 non-Member countries.The 2009 <strong>IAESTE</strong> Activity Reportcontains the detail on thebilateral exchanges, studyfields of trainees sent andreceived by each Memberand Co-operating Institution, thenumber of participating Employersand Institutions, training periods,age, nationality and gender of thetrainees and other useful comparativeinformation. It includes detail onthe exchange with non-Membercountries. The report also containsa summary of the administrativeprocedures, reports from Membersand Co-operating Institutions onactivity as well as the names of thestaff handling the exchange and theaddresses of the National Secretariats.Readers interested in this report mayorder a copy from the <strong>IAESTE</strong> NationalSecretariat in their own country orfrom the General Secretary.Exchange Development in 2009Figure 1 shows the number oftrainees sent in 2009 and comparesthis with previous four years. The totalnumber of trainees exchanged in2009 was 4073, 506 less than in 2008.However 37% of the Members andCo-operating Institutions managed toincrease their number of traineeshipsto incoming students and this was veryencouraging. Several countries madea significant increase in the numberof placements offered to incomingstudents, notably, India, Lebanon,Poland, Serbia, Syria, Tunisia and UnitedArab Emirates.Regional ExchangeThe number of traineeships filled bystudents from non–European countriesaccounted for 39% of the numberof students sent, up 5% from 2008.However figures show that there was anincrease in the number of students sentfrom Asia. Numbers sent and receivedin North and South America declined in2009.As shown on figure 2 Europe50004000300020001000Academic Institutions who offeredtraineeships. A total of 3388 IndustrialEmployers and 905 AcademicInstitutions received students in 2009.<strong>IAESTE</strong> would like to acknowledge thecontinued support of all Employers andEducational Institutions in 2009.Multilateral ExchangeThe open international exchangeis clearly illustrated by the number ofFigure 1: Total trainees sent02005 1 2006 2 2007 3 2008 4 2009 5Total trainees sent 4838 4778 4745 4579 4073Figure 1. Total Trainees SentFigure 2b: Training Periods for 2009continues to dominate the exchange. Members and Co-operating InstitutionsSome 61.3% of all trainees were sent that exchange with each other. InLess than 3from EU and other months European countries 2009 each Member 3 - 6 and months Co-operatingand 63.2% of all trainees 27.1% were received Institution exchanged13.1%on average within Europe, a decrease from 2008.17 other Members and Co-operatingInstitutions, same as 6 - in 122008.monthsParticipating Employers andFigure 3 shows that 59.3% 7.5% of <strong>IAESTE</strong>Educational InstitutionsMembers and Co-operating Institutionsexchanged with more More than 12 11 countriesmonthsIn 2009 there was another decrease in 2009. 6 Members sent students to 410.1%in the number of Employers and or more countries.6 REPORT1 - 2 months51.1%