Public transport in the Ljubljana Urban Region
Public transport in the Ljubljana Urban Region
Public transport in the Ljubljana Urban Region
- No tags were found...

Create successful ePaper yourself
Turn your PDF publications into a flip-book with our unique Google optimized e-Paper software.
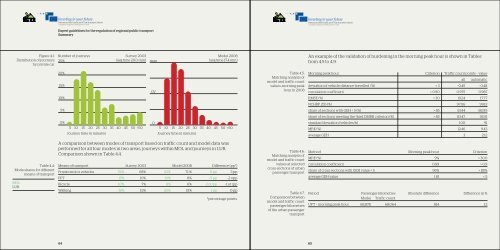
Expert guidel<strong>in</strong>es for <strong>the</strong> regulation of regional public <strong>transport</strong>SummaryFigure 4.1:Distribution of journeysby private carNumber of journeys25%Survey 2003(avg time 20.0 m<strong>in</strong>)maxModel 2008(avg time 17.4 m<strong>in</strong>)An example of <strong>the</strong> validation of burden<strong>in</strong>g <strong>in</strong> <strong>the</strong> morn<strong>in</strong>g peak hour is shown <strong>in</strong> Tablesfrom 4.5 to 4.9.20%15%OVTable 4.5:Match<strong>in</strong>g analysis ofmodel and traffic countvalues, morn<strong>in</strong>g peakhour <strong>in</strong> 2008Morn<strong>in</strong>g peak hour Criterion Traffic count po<strong>in</strong>ts – valueall automaticdeviation of vehicle distance travelled (%) < 3 –0.45 –0.48correlation coefficient > 0.90 0.975 0.98710%RMSE (%) < 30 19.24 17.77NCHRP 255 (%) 97.06 99.125%share of sections with GEH < 5 (%) > 85 81.44 88.99share of sections meet<strong>in</strong>g <strong>the</strong> third DMRB criterion (%) > 85 83.47 92.510%05 10 15 20 25 30 35 40 45 50 85%average GEH value 1.81 < 5Period Passenger-kilometres Absolute difference Difference <strong>in</strong> %Model Traffic countUPT – morn<strong>in</strong>g peak hour 68,878 68,064 814 1.264 65