Rural Strategy - Buckinghamshire County Council
Rural Strategy - Buckinghamshire County Council
Rural Strategy - Buckinghamshire County Council
- No tags were found...

Create successful ePaper yourself
Turn your PDF publications into a flip-book with our unique Google optimized e-Paper software.
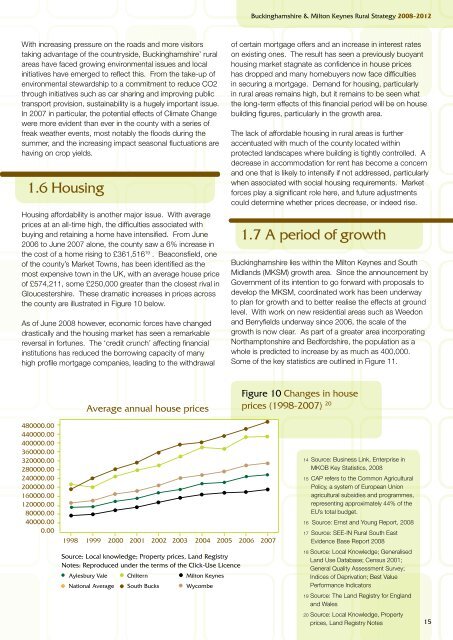
<strong>Buckinghamshire</strong> & Milton Keynes <strong>Rural</strong> <strong>Strategy</strong> 2008-2012With increasing pressure on the roads and more visitorstaking advantage of the countryside, <strong>Buckinghamshire</strong>’ ruralareas have faced growing environmental issues and localinitiatives have emerged to reflect this. From the take-up ofenvironmental stewardship to a commitment to reduce CO2through initiatives such as car sharing and improving publictransport provision, sustainability is a hugely important issue.In 2007 in particular, the potential effects of Climate Changewere more evident than ever in the county with a series offreak weather events, most notably the floods during thesummer, and the increasing impact seasonal fluctuations arehaving on crop yields.1.6 HousingHousing affordability is another major issue. With averageprices at an all-time high, the difficulties associated withbuying and retaining a home have intensified. From June2006 to June 2007 alone, the county saw a 6% increase inthe cost of a home rising to £361,516 19 . Beaconsfield, oneof the county’s Market Towns, has been identified as themost expensive town in the UK, with an average house priceof £574,211, some £250,000 greater than the closest rival inGloucestershire. These dramatic increases in prices acrossthe county are illustrated in Figure 10 below.As of June 2008 however, economic forces have changeddrastically and the housing market has seen a remarkablereversal in fortunes. The ‘credit crunch’ affecting financialinstitutions has reduced the borrowing capacity of manyhigh profile mortgage companies, leading to the withdrawalof certain mortgage offers and an increase in interest rateson existing ones. The result has seen a previously buoyanthousing market stagnate as confidence in house priceshas dropped and many homebuyers now face difficultiesin securing a mortgage. Demand for housing, particularlyin rural areas remains high, but it remains to be seen whatthe long-term effects of this financial period will be on housebuilding figures, particularly in the growth area.The lack of affordable housing in rural areas is furtheraccentuated with much of the county located withinprotected landscapes where building is tightly controlled. Adecrease in accommodation for rent has become a concernand one that is likely to intensify if not addressed, particularlywhen associated with social housing requirements. Marketforces play a significant role here, and future adjustmentscould determine whether prices decrease, or indeed rise.1.7 A period of growth<strong>Buckinghamshire</strong> lies within the Milton Keynes and SouthMidlands (MKSM) growth area. Since the announcement byGovernment of its intention to go forward with proposals todevelop the MKSM, coordinated work has been underwayto plan for growth and to better realise the effects at groundlevel. With work on new residential areas such as Weedonand Berryfields underway since 2006, the scale of thegrowth is now clear. As part of a greater area incorporatingNorthamptonshire and Bedfordshire, the population as awhole is predicted to increase by as much as 400,000.Some of the key statistics are outlined in Figure 11.Average annual house pricesFigure 10 Changes in houseprices (1998-2007) 20480000.00440000.00400000.00360000.00320000.00280000.00240000.00200000.00160000.00120000.0080000.0040000.000.001998 1999 2000 2001 2002 2003 2004 2005 2006 2007Source: Local knowledge; Property prices, Land RegistryNotes: Reproduced under the terms of the Click-Use LicenceAylesbury Vale Chiltern Milton KeynesNational Average South Bucks Wycombe14 Source: Business Link, Enterprise inMKOB Key Statistics, 200815 CAP refers to the Common AgriculturalPolicy, a system of European Unionagricultural subsidies and programmes,representing approximately 44% of theEU’s total budget.16 Source: Ernst and Young Report, 200817 Source: SEE-IN <strong>Rural</strong> South EastEvidence Base Report 200818 Source: Local Knowledge; GeneralisedLand Use Database; Census 2001;General Quality Assessment Survey;Indices of Deprivation; Best ValuePerformance Indicators19 Source: The Land Registry for Englandand Wales20 Source: Local Knowledge, Propertyprices, Land Registry Notes15