Mahowald et al 2006
Mahowald et al 2006
Mahowald et al 2006

Create successful ePaper yourself
Turn your PDF publications into a flip-book with our unique Google optimized e-Paper software.
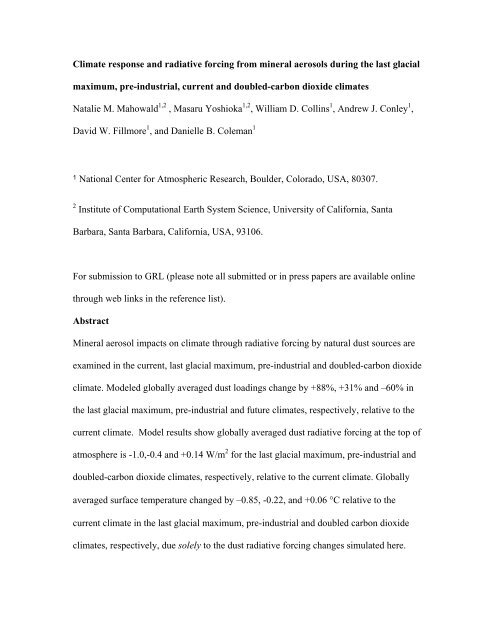
Climate response and radiative forcing from miner<strong>al</strong> aerosols during the last glaci<strong>al</strong>maximum, pre-industri<strong>al</strong>, current and doubled-carbon dioxide climatesNat<strong>al</strong>ie M. <strong>Mahow<strong>al</strong>d</strong> 1,2 , Masaru Yoshioka 1,2 , William D. Collins 1 , Andrew J. Conley 1 ,David W. Fillmore 1 , and Danielle B. Coleman 11 Nation<strong>al</strong> Center for Atmospheric Research, Boulder, Colorado, USA, 80307.2 Institute of Computation<strong>al</strong> Earth System Science, University of C<strong>al</strong>ifornia, SantaBarbara, Santa Barbara, C<strong>al</strong>ifornia, USA, 93106.For submission to GRL (please note <strong>al</strong>l submitted or in press papers are available onlin<strong>et</strong>hrough web links in the reference list).AbstractMiner<strong>al</strong> aerosol impacts on climate through radiative forcing by natur<strong>al</strong> dust sources areexamined in the current, last glaci<strong>al</strong> maximum, pre-industri<strong>al</strong> and doubled-carbon dioxideclimate. Modeled glob<strong>al</strong>ly averaged dust loadings change by +88%, +31% and –60% inthe last glaci<strong>al</strong> maximum, pre-industri<strong>al</strong> and future climates, respectively, relative to thecurrent climate. Model results show glob<strong>al</strong>ly averaged dust radiative forcing at the top ofatmosphere is -1.0,-0.4 and +0.14 W/m 2 for the last glaci<strong>al</strong> maximum, pre-industri<strong>al</strong> anddoubled-carbon dioxide climates, respectively, relative to the current climate. Glob<strong>al</strong>lyaveraged surface temperature changed by –0.85, -0.22, and +0.06 °C relative to thecurrent climate in the last glaci<strong>al</strong> maximum, pre-industri<strong>al</strong> and doubled carbon dioxideclimates, respectively, due solely to the dust radiative forcing changes simulated here.
These simulations only include natur<strong>al</strong> dust source response to climate change, andneglect possible impacts by human land and water use.1.0 IntroductionMiner<strong>al</strong> aerosols both absorb and scatter shortwave and long wave radiation, andthus are thought to modify climate [e.g. Miller and Tegen, 1998]. Addition<strong>al</strong>ly, miner<strong>al</strong>aerosol deposition to high latitude ice cores are 2-20 times higher during cold periods,such as the last glaci<strong>al</strong> maximum, than warm periods like today [e.g. P<strong>et</strong>it and <strong>al</strong>., 1999];and marine sediment records suggest that glob<strong>al</strong>ly dust deposition is 3-4 times higherduring cold periods than warm periods [Rea, 1994]. Thus, the large expected changes indust deposition in response to climate can play an important role in modulating climate.Although climate models can include the impact of miner<strong>al</strong> aerosols on climate[e.g. Miller and Tegen, 1998], there have not been published simulations of the climateresponse of miner<strong>al</strong> aerosols under different climate regimes using re<strong>al</strong>istic dustdistributions. Addition<strong>al</strong>ly, there have been limited estimates of radiative forcing underdifferent climates [Claquin, <strong>et</strong> <strong>al</strong>., 2002; Woodward <strong>et</strong> <strong>al</strong>., 2005]. Here, we include bothestimates of radiative forcing for four different time periods, as well as the climateresponse to those dust radiative forcings in the Nation<strong>al</strong> Center for AtmosphericResearch’s (NCAR) Community Climate System Model (CCSM3) [Collins <strong>et</strong> <strong>al</strong>., inpress-a]. We include only the climate response to ‘natur<strong>al</strong>’ sources of desert dust,because current estimates of the land use or water use impacts are not well constrained(see <strong>Mahow<strong>al</strong>d</strong>, <strong>et</strong> <strong>al</strong>. [2005] for review).
2.0 Modeling m<strong>et</strong>hodologyClimate models simulations are conducted in the Community Atmospheric Model(CAM3) of the CCSM [Collins, <strong>et</strong> <strong>al</strong>., <strong>2006</strong>]. The dust source, transport, depositionparam<strong>et</strong>erizations used for these simulations is described briefly in the online supplementand in d<strong>et</strong>ail in <strong>Mahow<strong>al</strong>d</strong>, <strong>et</strong> <strong>al</strong>. [<strong>2006</strong>] and is based on the Dust Entrainment andDeposition module [Zender, <strong>et</strong> <strong>al</strong>., 2003]. Radiative forcings and climate response arec<strong>al</strong>culated as described in Yoshioka, <strong>et</strong> <strong>al</strong>. [submitted, available athttp:www.cgd.ucar.edu/tss/staff/mahow<strong>al</strong>d]; a brief description is given in the onlinesupplement. We use the slab ocean model version of the model to <strong>al</strong>low dust feedbacksonto the sea surface temperature, but this does not <strong>al</strong>low for changes in the oceancirculation from the dust. The simulations in this paper have exactly the same boundaryconditions and radiative forcing (except for dust) as the slab ocean model simulationsthey are an extension of, which are described in more d<strong>et</strong>ail in Kiehl, <strong>et</strong> <strong>al</strong>. [<strong>2006</strong>] andOtto-Bliesner, <strong>et</strong> <strong>al</strong>. <strong>2006</strong>]. Please note that for the last glaci<strong>al</strong> maximum and preindustri<strong>al</strong>simulations, the slab ocean model heat fluxes are based on a fully coupledsimulation of these climates, [Otto-Bliesner, <strong>et</strong> <strong>al</strong>., <strong>2006</strong>]. Simulations for the current anddoubled-carbon dioxide climate are based on the ocean heat fluxes of the fully coupledsystem in the current climate [Kiehl <strong>et</strong> <strong>al</strong>., <strong>2006</strong>].The radiative forcing of dust is c<strong>al</strong>culated online using just one year ofsimulations (interannu<strong>al</strong> variability in loading is less than 10% in this simulation), asdescribed in more d<strong>et</strong>ail in Yoshioka <strong>et</strong> <strong>al</strong>. [submitted]. The default version of the CAM3includes a prescribed dust climatology for shortwave radiative forcing [Collins <strong>et</strong> <strong>al</strong>.,<strong>2006</strong>b]. For this paper, climate response is c<strong>al</strong>culated relative to the case where this
forcing is turned off, described in Yoshioka <strong>et</strong> <strong>al</strong>. [submitted]. Longwave and shortwaveforcings from dust are included in these results. The radiative forcings reported in thispaper are estimated as instantaneous n<strong>et</strong> forcings from both long wave and short wavewithout stratospheric adjustment.The sources of dust are <strong>al</strong>lowed to change with climate based on changes inveg<strong>et</strong>ation c<strong>al</strong>culated in the BIOME3 equilibrium veg<strong>et</strong>ation model [Haxeltine andPrentice, 1996], following the m<strong>et</strong>hodology of <strong>Mahow<strong>al</strong>d</strong>, <strong>et</strong> <strong>al</strong>. [1999]. We include theimpact of carbon dioxide on veg<strong>et</strong>ation in modifying the sources for the simulationsincluded here [see <strong>Mahow<strong>al</strong>d</strong> <strong>et</strong> <strong>al</strong>., <strong>2006</strong> for more cases]. These cases are c<strong>al</strong>led SOMB,SOMBLGMC, SOMBPIC and SOMBDC for the BIOME3 veg<strong>et</strong>ation based simulationsfor the current climate (SOMB, B meaning using the BIOME3 output), last glaci<strong>al</strong>maximum (LGM), pre-industri<strong>al</strong> (PI) and doubled-carbon dioxide climates (D),respectively (the C at the end of the acronym means that the carbon dioxide fertilizationeffect is included in the veg<strong>et</strong>ation change). We <strong>al</strong>so include a case where the radiativeforcing was examined in more d<strong>et</strong>ail, compared to other models and observations[Yoshioka <strong>et</strong> <strong>al</strong>., submitted], using the default veg<strong>et</strong>ation in the model (SOM). For the lastglaci<strong>al</strong> maximum, we include a case where glaciogenic sources are included and tuned tomatch observations (SOMBLGMT). We deduced the size of these sources using anoptimization <strong>al</strong>gorithm and available observations (terrestri<strong>al</strong> sediment, ice and marinesediment cores), and use those source areas for this study. These simulations, includingcomparisons to observations (concentration, deposition and aerosol optic<strong>al</strong> depth) aredescribed in more d<strong>et</strong>ail in <strong>Mahow<strong>al</strong>d</strong> <strong>et</strong> <strong>al</strong>. [<strong>2006</strong>].
3.0 ResultsA comparison of the results of this study to available observations is given in<strong>Mahow<strong>al</strong>d</strong> <strong>et</strong> <strong>al</strong>. [<strong>2006</strong>]. The climate response of dust to these different climates includesthe impact of changes in veg<strong>et</strong>ation (from carbon dioxide fertilization, precipitation,temperature and insolation changes), surface winds, precipitation and soil moisture. Thedust response to source area is much stronger than to surface winds or precipitation inthis model, as described in <strong>Mahow<strong>al</strong>d</strong> <strong>et</strong> <strong>al</strong>. [<strong>2006</strong>]. The glob<strong>al</strong>ly averaged dust sourcechanges by +105%, +164%, +51% and –64% relative to the current climate (SOMB) forthe SOMBLGMC, SOMBLGMT, SOMBPIC, and SOMBDC cases, respectively, whendust direct radiative feedback is included in the models (Table 1). The latitudin<strong>al</strong>distribution of the sources expands to northern high latitudes under last glaci<strong>al</strong> maximumconditions, similar to previous studies [e.g. <strong>Mahow<strong>al</strong>d</strong> <strong>et</strong> <strong>al</strong>., 1999]. Notice that addingthe impact of the glaciogenic sources on dust (and tuning the model to best match theobservations) increases our dust source and loading in the extra-tropics in the last glaci<strong>al</strong>maximum in our simulations (SOMBLGMT vs. SOMBLGMC). Atmospheric desert dustaerosol optic<strong>al</strong> depth (500 nm) changes dramatic<strong>al</strong>ly during the different climates due tothe changes in source strength (Figure 1a). Glob<strong>al</strong>ly averaged dust aerosol optic<strong>al</strong> depth(AOD) change by +81%, +88%, +31% and –60% in the SOMBLGMC, SOMBLGMT,SOMBPIC and SOMBDC cases relative to the SOMB case, respectively (Table 1). Theresponse of dust sources and deposition to climate change is discussed in more d<strong>et</strong>ail andcompared to available observations in <strong>Mahow<strong>al</strong>d</strong> <strong>et</strong> <strong>al</strong>. [<strong>2006</strong>]. Note that the dust sourcestrength and loadings in this study will differ slightly from that in <strong>Mahow<strong>al</strong>d</strong> <strong>et</strong> <strong>al</strong>. [<strong>2006</strong>]
ecause we are reporting the results from simulations including the radiative feedbacks ofprognostic dust, while those results were without radiative feedback of predicted dust.Table 1: Dust impacts on climateSOM SOMB SOMLGMC SOMLGMT SOMBPIC SOMBDCDust Source (Tg/year) 4650 5320 10880 14020 8040 1930Dust AOD (500 nm) 0.039 0.053 0.096 0.099 0.069 0.021TOA RF (W/m 2 ) -0.46 -0.43 -0.96 -1.47 -0.87 -0.29Sfc RF (W/m 2 ) -0.60 -0.56 -1.28 -1.59 -1.03 -0.36Change from dust radiative feedbacksSfc. T (°K) -0.20 -0.19 -1.00 -1.04 -0.41 -0.13Precip (mm/day) -0.035 -0.033 -0.095 -0.091 -0.049 -0.017Change relative to current from dust radiative feedbacksTOA RF (W/m 2 ) -0.53 -1.04 -0.43 0.14Sfc RF (W/m 2 ) -0.72 -1.02 -0.47 0.20Sfc. T (°K) -0.81 -0.85 -0.22 0.06Dust radiative forcing changes with climate and the amount of dust, and theradiative forcings are highest at the latitudes with the most dust, <strong>al</strong>though the relationshipis not strictly linear (Figure 1a, 1b and 1c). The glob<strong>al</strong>ly averaged largest radiativeforcings are seen in climates with the largest change in aerosol optic<strong>al</strong> depth (Table 1).Our top of atmosphere radiative forcing tend to have larger longwave and sm<strong>al</strong>ler shortwave components than previous modeling studies, <strong>al</strong>though these results are consistentwith available observations, as discussed in d<strong>et</strong>ail in Yoshioka <strong>et</strong> <strong>al</strong>. [submitted], andbriefly in the online supplement. The case where we consider the impact of glaciogenicsources in the LGM has higher dust loading than without these sources (case
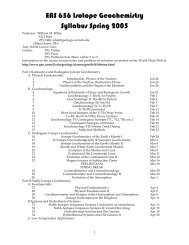
SOMBLGMT vs. SOMBLGMC in Figure 1a) and a larger magnitude of radiative forcing(Figure 1c and d). If we look in more d<strong>et</strong>ail at the radiative forcings, we see that thisincrease is a b<strong>al</strong>ance b<strong>et</strong>ween large negative radiative forcings over ocean, sm<strong>al</strong>l negativeforcings over land and positive radiative forcings over the ice she<strong>et</strong>s (see onlinesupplement for spati<strong>al</strong> plots). Even though adding glaciogenic sources increases our dustover ice she<strong>et</strong>s, it increases the dust loading more over oceans, and thus is more negative(SOMLGMT vs. SOMLGMC—see online supplement for figures). More discussion onthe comparison of our radiative forcing results to published results is in the onlinesupplement.The climate response to dust can occur at different latitudes than the radiativeforcing. Here we show the difference in surface temperature (radiative) b<strong>et</strong>ween the casewhere dust radiative forcing is included in the climate simulation minus the case wher<strong>et</strong>here is no radiative forcing, for each climate. The response of surface temperature todust radiative forcing tends to be b<strong>et</strong>ween 0.1 and 2.1 °C cooling, and these v<strong>al</strong>ues arestatistic<strong>al</strong>ly significant across a broad range of latitudes (Figure 1d). The strongestcooling occurs in northern midlatitudes (Figure 1d), even when the dust optic<strong>al</strong> depth andradiative forcing has a larger magnitude in the tropics (Figure 1a, b, and c). The strongestresponse in temperature occurs at 40-90 °N in the last glaci<strong>al</strong> maximum cases, and isapproximately 2 °C. It is unclear why the response should be largest at northernmidlatitudes, but it could be due to the lower heat capacity of land versus ocean, and thelarge portion of land at this latitude.The climate response of precipitation to the dust radiative forcing tends to be ashift in the precipitation to the hemisphere with less dust (Figure 1e) and a decrease in the
glob<strong>al</strong>ly averaged precipitation (Table 1). Our results suggest that further study of theimportance of climate feedbacks of desert dust aerosols is warranted, and suggests somepatterns that are robust across different climates in our simulations.4.0 DiscussionRadiative forcings and climate feedbacks from atmospheric desert dust for lastglaci<strong>al</strong> maximum, pre-industri<strong>al</strong>, current and doubled-carbon dioxide climates arec<strong>al</strong>culated for the first time in one single modeling framework. Included in these dustscenarios are changes in dust sources due to changes in veg<strong>et</strong>ation using the BIOME3equilibrum veg<strong>et</strong>ation model [Haxeltine and Prentice, 1996] and glaciogenic sources inthe last glaci<strong>al</strong> maximum. We include in the model only the response due to veg<strong>et</strong>ationchanges, soil moisture and surface winds in this simulation, and ignore possible changesdue to human land or water use [e.g. <strong>Mahow<strong>al</strong>d</strong> and Luo, 2003; <strong>Mahow<strong>al</strong>d</strong> <strong>et</strong> <strong>al</strong>, 2005];estimates of anthropogenic radiative forcing and climate feedbacks including land use aregiven in the online supplement, based on previous studies. Comparisons of the dustdistribution in this study to available observations is conducted in a separate paper[<strong>Mahow<strong>al</strong>d</strong> <strong>et</strong> <strong>al</strong>., <strong>2006</strong>]; and shows a good performance of the model. The n<strong>et</strong>instantaneous top-of-atmosphere radiative forcing differences due to dust b<strong>et</strong>ween the lastglaci<strong>al</strong> maximum, pre-industri<strong>al</strong> and doubled-carbon dioxide climates and the currentclimate are –0.53, -0.43, and +0.14 W/m 2 , respectively. If we include the impact ofglaciogenic sources, the n<strong>et</strong> top-of-atmosphere radiative forcing difference b<strong>et</strong>ween thelast glaci<strong>al</strong> maximum and the current climate increases in magnitude to –1.04 W/m 2 . Inthe future we simulate a 0.14 W/m 2 increase in radiative forcing because of a reduction indust from carbon dioxide fertilization of the veg<strong>et</strong>ation. It is uncertain that the carbon
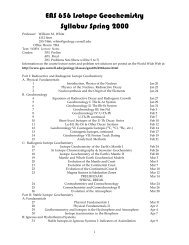
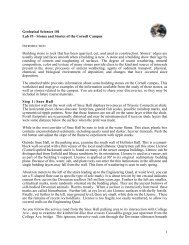
dioxide fertilization effect will continue in the future, when other nutrients may becomelimiting [Smith <strong>et</strong> <strong>al</strong>., 2000; Schlesinger and Lichter, 2001]. Indeed other studies includ<strong>et</strong>he impact of climate induced desertification and obtain a significant increase in desertdust in the future [Woodward <strong>et</strong> <strong>al</strong>, 2005] while others simulate little change [Tegen <strong>et</strong><strong>al</strong>., 2004], suggesting that more studies of veg<strong>et</strong>ation and climate interactions are vit<strong>al</strong> topredicting future dust.There is roughly a linear relationship b<strong>et</strong>ween annu<strong>al</strong>ly averaged aerosol optic<strong>al</strong>depth and radiative forcing under different climates in the model simulations (Table 1and see Online Supplement for figure); the correlation coefficients are –0.96 and –0.92and the slopes are –14.7 and –13.0 W/m 2 / AOD, for top-of-atmosphere and surfaceradiative forcing, respectively. Glob<strong>al</strong>ly averaged surface temperature changed by –0.85, -0.22, and +0.06 °C relative to the current climate in the last glaci<strong>al</strong> maximum, preindustri<strong>al</strong>and doubled carbon dioxide climates, respectively, due solely to the dustradiative forcing changes simulated here. The response in surface temperature orprecipitation to dust forcing is approximately linear in this model in these differentclimates, with correlation coefficients of -0.94 and –0.98, respectively (Table 1 and seeOnline Supplement for figure). The slope in the glob<strong>al</strong> response is –12.7 °C/AOD and -1.0 mm/day/AOD for surface temperature and precipitation, respectively. These v<strong>al</strong>uesshould be considered tentative, due to both the shortness of these simulations, and thedependence of these v<strong>al</strong>ues on specific model characteristics. However, that the responseremains linear while the surface <strong>al</strong>bedo changes so strongly, suggests a robust response ofsurface temperature and precipitation to aerosol optic<strong>al</strong> depth with this s<strong>et</strong> of optic<strong>al</strong>properties. More an<strong>al</strong>ysis of the differences b<strong>et</strong>ween dust impacts on climate in this
model and other models are discussed in Yoshioka <strong>et</strong> <strong>al</strong>. [submitted]. The sensitivity ofdust feedback results to optic<strong>al</strong> properties is explored in Miller <strong>et</strong> <strong>al</strong>. [2004]. Theseresults will ignore the impact of dust radiation on changes in ocean circulation, since weuse a slab ocean model. We explore the efficacy of dust forcing within our model in theonline supplement.In the last glaci<strong>al</strong> maximum, our results suggest a radiative forcing relativ<strong>et</strong>o the current climate of –1.04 W/m 2 at the top of atmosphere, for the case includingglaciogenic sources and best matches available deposition observations. Compared to theforcings from carbon dioxide (-1.7 W/m 2 ) and insolation and <strong>al</strong>bedo (-5.2 W/m 2 ) [e.g.Hewitt and Mitchell, 1997], the dust forcings are about 15% of the tot<strong>al</strong> of other forcings.The surface temperature response from dust is –0.85 ºC relative to the current climate,while the changes in carbon dioxide, insolation and <strong>al</strong>bedo in the same simulations causea change in surface temperature of 5.6 ºC.Despite the possible sensitivity of the results to our model specifications, ourresults suggest some interesting relationships across the different climate studies.Radiative forcing at the top-of-atmosphere and surface is linear with aerosol optic<strong>al</strong>depth, even in different climates. Climate response in surface temperature andprecipitation are roughly linear with aerosol optic<strong>al</strong> depth in our model, with a decreasein both surface temperature and precipitation associated with increasing optic<strong>al</strong> depth.Fin<strong>al</strong>ly, our model predicts statistic<strong>al</strong>ly significant decreases in temperature at manylatitudes (not just close to the dust sources) when dust is added in the different climates,and a shift in precipitation from the northern part of the ITCZ to the southern part of theITCZ.
AcknowledgementsThis work was supported by NASA-IDS (NAG5-9671), NSF-Biocomplexity (OCE-9981398) and DOE (DE-FG02-02ER-63387). Simulations were conducted at theNation<strong>al</strong> Center for Atmospheric Research, which is funded by the Nation<strong>al</strong> ScienceFoundation. This manuscript was improved by comments from the anonymous reviewersand Ron Miller.ReferencesClaquin, T., <strong>et</strong> <strong>al</strong>. (2002), Radiative forcing of climate by ice-age atmospheric dust,Climate Dynamics, 20, 193-202.W. D. Collins, C. M. Bitz, M. L. Blackmon, G. B . Bonan, C. S. Br<strong>et</strong>herton, J. A. Carton,P. Chang, S. C. Doney, J. J. Hack, T. B. Henderson, J. T. Kiehl, W. G. Large, D.S. McKenna, B. D. Santer, and R. D. Smith (<strong>2006</strong>-a), The Community ClimateSystem Model: CCSM3, Journ<strong>al</strong> of Climate, (19) 2122-2143.Collins, W. D., <strong>et</strong> <strong>al</strong>. (<strong>2006</strong>-b), The formulation and atmospheric simulation of theCommunity Atmopshere Model, CAM3., Journ<strong>al</strong> of Climate, (19) 2144-2161.Haxeltine, A., and I. C. Prentice (1996), BIOME3: An equilibrium terrestri<strong>al</strong> biospheremodel based on ecophysiologic<strong>al</strong> constraints, resource availability, andcomp<strong>et</strong>ition among plant function<strong>al</strong> types, Glob<strong>al</strong> Biogeochemic<strong>al</strong> Cycles, 10,693-709.
Hewitt, C., and J. Mitchell (1997), Radiative forcing and repsonse of a GCM to ice ageboundary conditions: cloud feedback and climate sensitivity, Climate Dynamics,13, 821-834.Kiehl, J., C. Shields, J. Hack, and W.Collins (in press), The climate sensitivity of theCommunity Climate System Model: CCSM3, Journ<strong>al</strong> of Climate (11) 2584-2596.<strong>Mahow<strong>al</strong>d</strong>, N., A. Baker, G. Bergam<strong>et</strong>ti, N. Brooks, R. Duce, T. Jickells, N. Kubilay, J.Prospero, and I. Tegen (2005), The atmospheric glob<strong>al</strong> dust cycle and iron inputsto the ocean, Glob<strong>al</strong> Biogeochemic<strong>al</strong> Cycles, 19, GB4025,10.1029/2004GB002402, 2005.<strong>Mahow<strong>al</strong>d</strong>, N., K. Kohfeld, M. Hansson, Y. B<strong>al</strong>kanski, S. P. Harrison, I. C. Prentice, M.Schulz, and H. Rodhe (1999), Dust sources and deposition during the last glaci<strong>al</strong>maximum and current climate: A comparison of model results with p<strong>al</strong>eodatafrom ice cores and marine sediments, Journ<strong>al</strong> of Geophysic<strong>al</strong> Research, 104,15,895-815,916.<strong>Mahow<strong>al</strong>d</strong>, N. M., and C. Luo (2003), A less dusty future? Geophysic<strong>al</strong> Research L<strong>et</strong>ters,30, 1903, doi: 1910.1029/2003GRL017880.<strong>Mahow<strong>al</strong>d</strong>, N., D. Muhs, S. Levis, P. Rasch, M. Yoshioka, and C. Zender (<strong>2006</strong>), Changein atmospheric miner<strong>al</strong> aerosols in response to climate: last glaci<strong>al</strong> period, preindustri<strong>al</strong>,modern and doubled-carbon dioxide climates, Journ<strong>al</strong> of Geophysic<strong>al</strong>Research (111) D10202, doi:10.1029/2005JD006653.<strong>Mahow<strong>al</strong>d</strong>, N., G. Rivera, and C. Luo (2004), Comment on "Relative importance ofclimate and land use in d<strong>et</strong>ermining present and future glob<strong>al</strong> soil dust emission",Geophysic<strong>al</strong> Research L<strong>et</strong>ters, 31, 10.1029/2004GL021272.
Miller, R., and I. Tegen (1998), Climate Response to Soil Dust Aerosols, Journ<strong>al</strong> ofClimate, 11, 3247-3267.Miller, R. I. Tegen, J. Perlwitz, Surface radiative forcing by soil aerosols and thehydrologic<strong>al</strong> cycle, J. Geophysic<strong>al</strong> Res. (109)D04203/doi:10.1029/2003JD004085, 2004.Otto-Bliesner, B., E. Brady, G. Clauz<strong>et</strong>, R. Tomas, S. Levis, and Z. Kothav<strong>al</strong>a Lastglaci<strong>al</strong> maximum and holocene climate in CCSM3, Journ<strong>al</strong> of Climate (11),2526-2544.P<strong>et</strong>it, J. R., and e. <strong>al</strong>. (1999), Climate and atmospheric history of hte past 420,000 yearsfrom teh Vostok Ice core, Antarctica, Nature, 399, 429-436.Rea, D. K. (1994), The P<strong>al</strong>eoclimatic record provided by eolian deposition in the deepsea: The geologic history of wind, Reviews of Geophysics, 32, 159-195.Schlesinger, W. H., and J. Lichter (2001), Limited carbon storage in soil and litter ofexperiment<strong>al</strong> forest plots under increased atmospheric CO 2 , Nature, 411, 466-469.Smith, S., T. Huxman, S. Zitzer, T. Charl<strong>et</strong>, D. Housman, J. Coleman, L. Fenstermaker, J.Seemann, and R. Nowak (2000), Elevated CO2 increases productivity andinvasive species success in an arid ecosystem, Nature, 408, 79-82.Tegen, I., M. Werner, S. P. Harrison, and K. E. Kohfeld (2004), Relative importance ofclimate and land use in d<strong>et</strong>ermining present and future glob<strong>al</strong> soil dust emission,Geophysic<strong>al</strong> Research L<strong>et</strong>ters, 31, L05105, doi:05110.01029/02003GL019216,012004.
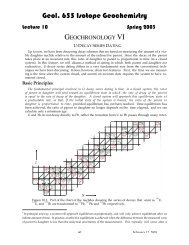
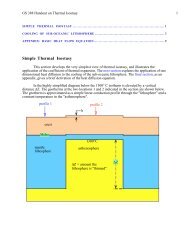
Woodward, S., D. Roberts, and R. B<strong>et</strong>ts (2005), A simulation of the effect of climatechanged-induced desertification on miner<strong>al</strong> dust aerosol, Geophysic<strong>al</strong> ResearchL<strong>et</strong>ters, 32, L18810, doi:18810.11029/12005GL023482.Yoshioka, M., N. <strong>Mahow<strong>al</strong>d</strong>, A. Conley, W. Collins, D. Fillmore, C. Zender, and D.Coleman, Impact of dust radiative forcing on Sahel Precipitation, Journ<strong>al</strong> ofClimate (submitted—available at www.cgd.ucar.edu/tss/staff/mahow<strong>al</strong>d).Zender, C., H. Bian, and D. Newman (2003), Miner<strong>al</strong> Dust Entrainment and Deposition(DEAD) model: Description and 1990s dust climatology, Journ<strong>al</strong> of Geophysic<strong>al</strong>Research, 108, 4416.Figure captionsFigure 1: Zon<strong>al</strong>ly averaged v<strong>al</strong>ues for the SOM, SOMB, SOMBLGMC, SOMBLGMT,SOMBPIC and SOMBDC cases for a) dust optic<strong>al</strong> depth (500 nm), b) dust n<strong>et</strong>radiative forcing at the top of atmosphere (TOA), c) dust n<strong>et</strong> radiative forcing atthe surface (SFC), d) surface temperature (radiative) response (only v<strong>al</strong>uessignificant at 95% are shown) and e) precipitation response (only v<strong>al</strong>uessignificant at 95% are shown).
Dust aerosol optic<strong>al</strong> depthLatitudeSurface radiative forcing (W/m2)Top-of-Atmosphere radiative forcing (W/m2)Change in surface temperature (C)Change in precipitation (mm/day)Latitude
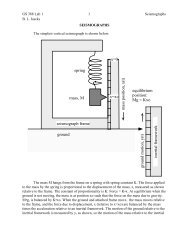
Surface Temperature response from dustSurface Temperature (K)Years of simulation
RF (W/m2)AOD vs. RFAOD vs. TsAOD vs. Precip0.00.00.0-0.2-0.02-0.5-1.0-0.4-0.6-0.04-0.06-1.5-0.8-0.08-1.0-0.100.0 0.04 0.08 0.12AOD0.0 0.04 0.08AOD0.12 0.0 0.04 0.08AOD0.12Ts (C)Precip (mm/day)