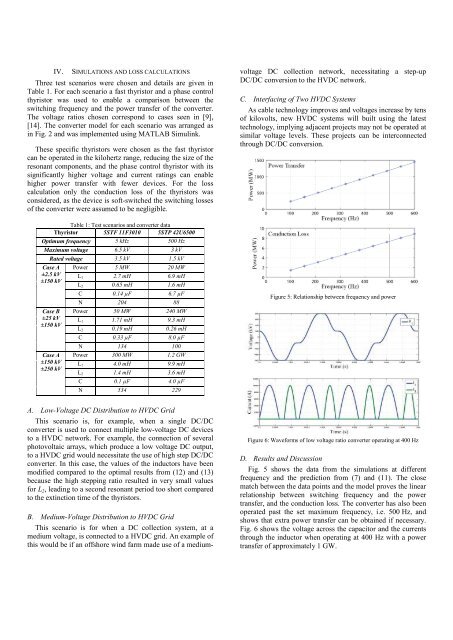
IV.SIMULATIONS AND LOSS CALCULATIONSThree test scenarios were chosen and details are given <strong>in</strong>Table 1. For each scenario a fast thyristor and a phase controlthyristor was used to enable a comparison between theswitch<strong>in</strong>g frequency and the power transfer <strong>of</strong> the converter.The voltage ratios chosen correspond to cases seen <strong>in</strong> [9],[14]. The converter model for each scenario was arranged as<strong>in</strong> Fig. 2 and was implemented us<strong>in</strong>g MATLAB Simul<strong>in</strong>k.These specific thyristors were chosen as the fast thyristorcan be operated <strong>in</strong> the kilohertz range, reduc<strong>in</strong>g the size <strong>of</strong> theresonant components, and the phase control thyristor with itssignificantly higher voltage and current rat<strong>in</strong>gs can enablehigher power transfer with fewer devices. For the losscalculation only the conduction loss <strong>of</strong> the thyristors wasconsidered, as the device is s<strong>of</strong>t-switched the switch<strong>in</strong>g losses<strong>of</strong> the converter were assumed to be negligible.Table 1: Test scenarios and converter dataThyristor 5STF 11F3010 5STP 42U6500Optimum frequency 5 kHz 500 HzMaximum voltage 6.5 kV 3 kVRated voltage 3.5 kV 1.5 kVPower 5 MW 20 MWCase A±2.5 kV±150 kVCase B±25 kV±150 kVCase A±150 kV±250 kVL 1 2.7 mH 6.9 mHL 2 0.65 mH 1.6 mHC 0.14 µF 6.7 µFN 204 88Power 50 MW 240 MWL 1 1.71 mH 9.3 mHL 2 0.19 mH 0.26 mHC 0.33 µF 8.0 µFN 134 100Power 300 MW 1.2 GWL 1 4.0 mH 9.9 mHL 2 1.4 mH 3.6 mHC 0.1 µF 4.0 µFN 534 229This scenario is for when a <strong>DC</strong> collection system, at amedium voltage, is connected to a HV<strong>DC</strong> grid. An example <strong>of</strong>this would be if an <strong>of</strong>fshore w<strong>in</strong>d farm made use <strong>of</strong> a mediumvoltage<strong>DC</strong> collection network, necessitat<strong>in</strong>g a step-up<strong>DC</strong>/<strong>DC</strong> conversion to the HV<strong>DC</strong> network.C. Interfac<strong>in</strong>g <strong>of</strong> Two HV<strong>DC</strong> SystemsAs cable technology improves and voltages <strong>in</strong>crease by tens<strong>of</strong> kilovolts, new HV<strong>DC</strong> systems will built us<strong>in</strong>g the latesttechnology, imply<strong>in</strong>g adjacent projects may not be operated atsimilar voltage levels. These projects can be <strong>in</strong>terconnectedthrough <strong>DC</strong>/<strong>DC</strong> conversion.Figure 5: Relationship between frequency and powerA. Low-Voltage <strong>DC</strong> Distribution to HV<strong>DC</strong> GridThis scenario is, for example, when a s<strong>in</strong>gle <strong>DC</strong>/<strong>DC</strong>converter is used to connect multiple low-voltage <strong>DC</strong> devicesto a HV<strong>DC</strong> network. For example, the connection <strong>of</strong> severalphotovoltaic arrays, which produce a low voltage <strong>DC</strong> output,to a HV<strong>DC</strong> grid would necessitate the use <strong>of</strong> high step <strong>DC</strong>/<strong>DC</strong>converter. In this case, the values <strong>of</strong> the <strong>in</strong>ductors have beenmodified compared to the optimal results from (12) and (13)because the high stepp<strong>in</strong>g ratio resulted <strong>in</strong> very small valuesfor L 2 , lead<strong>in</strong>g to a second resonant period too short comparedto the ext<strong>in</strong>ction time <strong>of</strong> the thyristors.B. Medium-Voltage Distribution to HV<strong>DC</strong> GridFigure 6: Waveforms <strong>of</strong> low voltage ratio converter operat<strong>in</strong>g at 400 HzD. Results and DiscussionFig. 5 shows the data from the simulations at differentfrequency and the prediction from (7) and (11). The closematch between the data po<strong>in</strong>ts and the model proves the l<strong>in</strong>earrelationship between switch<strong>in</strong>g frequency and the powertransfer, and the conduction loss. The converter has also beenoperated past the set maximum frequency, i.e. 500 Hz, andshows that extra power transfer can be obta<strong>in</strong>ed if necessary.Fig. 6 shows the voltage across the capacitor and the currentsthrough the <strong>in</strong>ductor when operat<strong>in</strong>g at 400 Hz with a powertransfer <strong>of</strong> approximately 1 GW.
Table 2 shows the relationship between the switch<strong>in</strong>gfrequency and power transfer and conduction power loss forthe three scenarios for both thyristors. The conduction ratio isthe ratio <strong>of</strong> the conduction loss to the power transfer for theconverter and, accord<strong>in</strong>g to the model (7) and (11), is equal<strong>in</strong>dependent from the frequency, as long as the converter isoperated <strong>in</strong> ADM.Table 2: Simulation resultsThyristor 5STF 11F3010 5STP 42U6500P 1 kW/Hz 40 kW/HzCase A Pc 218 W/Hz 3.45 kW/HzPc/P 21.8% 8.6%P 10 kW/Hz 480 kW/HzCase B Pc 184.22 W/Hz 5.29 kW/HzPc/P 1.8% 1.1%P 600 kW/Hz 2.4M W/HzCase C Pc 911 W/Hz 14.77 kW/HzPc/P 1.5% 0.6%From these results, it can be seen that the l<strong>in</strong>ear relationshipis confirmed between the switch<strong>in</strong>g frequency and the powertransfer and conduction loss <strong>of</strong> the device. It was alsoobserved from simulations that conduction losses decrease asthe voltage conversion ratio is reduced. This makes theconverter suitable for use <strong>in</strong> <strong>in</strong>terfac<strong>in</strong>g two HV<strong>DC</strong> systems,when operated <strong>in</strong> ADM. However, for medium to high voltageconversion ratios the exhibits significant conduction lossesdeem<strong>in</strong>g it unsuitable for use <strong>in</strong> <strong>in</strong>terfac<strong>in</strong>g low-voltage <strong>DC</strong>systems with a HV<strong>DC</strong> grid. The results also <strong>in</strong>dicate that thephase control thyristor has superior loss figures and fewerdevices per arm given the devices higher rat<strong>in</strong>gs, at theexpense <strong>of</strong> larger and possibly more costly passivecomponents.V. CONCLUSIONHav<strong>in</strong>g outl<strong>in</strong>ed the importance <strong>of</strong> <strong>DC</strong> to <strong>DC</strong> conversion <strong>in</strong>future HV<strong>DC</strong> networks, a resonant converter topology wasstudied. An alternative operat<strong>in</strong>g pr<strong>in</strong>ciple for this topologywas presented, <strong>in</strong>volv<strong>in</strong>g an alternate operation <strong>of</strong> the twohalves <strong>of</strong> the topology. A full set <strong>of</strong> equations describ<strong>in</strong>g thework<strong>in</strong>g <strong>of</strong> the converter runn<strong>in</strong>g <strong>in</strong> this mode were drawn andestimation <strong>of</strong> the conduction losses performed. The converterwas modeled <strong>in</strong> different HV<strong>DC</strong> grid scenarios to show itspotential diversity <strong>of</strong> applications. It was seen that theconverter exhibits low losses at low conversion ratios and issuited best to <strong>in</strong>terfac<strong>in</strong>g HV<strong>DC</strong> systems up to mediumconversion ratio. A comparison between two different types <strong>of</strong>semiconductors, i.e. high rat<strong>in</strong>gs or fast switch<strong>in</strong>g thyristors,has also been conduct<strong>in</strong>g. On one hand, the higher rat<strong>in</strong>gsthyristors exhibit the lowest conduction losses over all thescenarios. On the other hand, the fast switch<strong>in</strong>g thyristorspermit the converter to be operated at a much higherfrequency, potentially hav<strong>in</strong>g benefits <strong>in</strong> terms <strong>of</strong> passivecomponents volume and cost.REFERENCES[1] D. Van Hertem, M. Ghandhari, and M. Delimar, “Technicallimitations towards a SuperGrid — A European prospective,” <strong>in</strong>2010 IEEE International Energy Conference, 2010, pp. 302–309.[2] D. Van Hertem, M. Ghandhari, J. Curis, O. Despouys, and A.Marz<strong>in</strong>, “Protection requirements for a multi-term<strong>in</strong>al meshed <strong>DC</strong>grid,” Cigre Conference Bologna 2011, pp. 1–4.[3] C. M. Franck, “HV<strong>DC</strong> Circuit Breakers: A Review Identify<strong>in</strong>gFuture Research Needs,” IEEE Transactions on Power Delivery,vol. 26, no. 2, pp. 998–1007, Apr. 2011.[4] J. Häfner and B. Jacobson, “Proactive Hybrid HV<strong>DC</strong> Breakers - Akey <strong>in</strong>novation for reliable HV<strong>DC</strong> grids,” The electric power system<strong>of</strong> the future - Integrat<strong>in</strong>g supergrids and microgrids Internationalsymposium - Cigré, 2011.[5] M. M. C. Merl<strong>in</strong>, T. C. Green, P. D. Mitcheson, D. R. Tra<strong>in</strong>er, D. R.Critchley, and R. W. Crookes, “A new hybrid multi-level voltagesourceconverter with <strong>DC</strong> fault block<strong>in</strong>g capability,” <strong>in</strong> 9th IETInternational Conference on AC and <strong>DC</strong> Power Transmission(AC<strong>DC</strong> 2010), 2010, pp. 1–5.[6] C. D. Barker, C. C. Davidson, D. R. Tra<strong>in</strong>er, and R. S. Whitehouse,“Requirements <strong>of</strong> <strong>DC</strong>-<strong>DC</strong> <strong>Converter</strong>s to facilitate large <strong>DC</strong> Grids,”<strong>in</strong> Cigre Session 2012, 2012.[7] D. Jovcic, “Step-up <strong>DC</strong>–<strong>DC</strong> converter for megawatt sizeapplications,” IET Power Electronics, vol. 2, no. 6, p. 675, 2009.[8] J. Arrillaga, High Voltage Direct Current Transmission, 2nd ed.The Institution <strong>of</strong> Electrical Eng<strong>in</strong>eers, 1998.[9] T. Lüth, M. M. C. Merl<strong>in</strong>, T. C. Green, C. D. Barker, F. Hassan, R.W. Critchley, R. W. Crookes, and K. Dyke, “Performance <strong>of</strong> a <strong>DC</strong> /AC / <strong>DC</strong> VSC System to Interconnect HV<strong>DC</strong> Systems,” <strong>in</strong> 10th IETInternational Conference on AC and <strong>DC</strong> Power Transmission(AC<strong>DC</strong> 2012), 2012, no. Figure 2.[10] N. Mohan, T. M. Undeland, and W. P. Robb<strong>in</strong>s, Power Electronics:converters, applications, and design, 3rd ed. 2003.[11] A. Hagar, “A New Family <strong>of</strong> Transformerless Modular <strong>DC</strong>-<strong>DC</strong><strong>Converter</strong>s for High Power Applications,” University <strong>of</strong> Toronto,2011.[12] D. Jovcic, “Bidirectional, high-power <strong>DC</strong> transformer,” PowerDelivery, IEEE Transactions on, vol. 24, no. 4, pp. 2276–2283,2009.[13] D. Jovcic and B. T. Ooi, “Theoretical aspects <strong>of</strong> fault isolation onhigh-power direct current l<strong>in</strong>es us<strong>in</strong>g resonant direct current/directcurrent converters,” IET Generation, Transmission & Distribution,vol. 5, no. 2, p. 153, 2011.[14] P. Monjean, J. Delanoe, D. Mar<strong>in</strong>, J. Auguste, C. Saudemont, andB. Robyns, “Control strategies <strong>of</strong> <strong>DC</strong>-based <strong>of</strong>fshore w<strong>in</strong>d farm,” <strong>in</strong>14th European Conference on Power Electronics and Applications(EPE 2011), 2011, pp. 1–9.