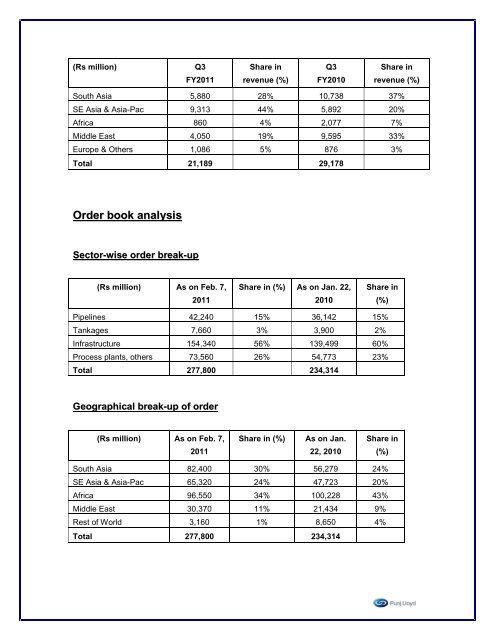
(Rs million)Q3Share inQ3Share in<strong>FY2011</strong>revenue (%)FY2010revenue (%)South Asia 5,880 28% 10,738 37%SE Asia & Asia-Pac 9,313 44% 5,892 20%Africa 860 4% 2,077 7%Middle East 4,050 19% 9,595 33%Europe & Others 1,086 5% 876 3%Total 21,189 29,178Order book analysisSector-wise order break-up(Rs million) As on Feb. 7,2011Share in (%) As on Jan. 22,2010Share in(%)Pipelines 42,240 15% 36,142 15%Tankages 7,660 3% 3,900 2%Infrastructure 154,340 56% 139,499 60%Process plants, others 73,560 26% 54,773 23%Total 277,800 234,314Geographical break-up of order(Rs million) As on Feb. 7,Share in (%)As on Jan.Share in201122, 2010(%)South Asia 82,400 30% 56,279 24%SE Asia & Asia-Pac 65,320 24% 47,723 20%Africa 96,550 34% 100,228 43%Middle East 30,370 11% 21,434 9%Rest of World 3,160 1% 8,650 4%Total 277,800 234,314
Key Orders:During the nine months under review <strong>Punj</strong> <strong>Lloyd</strong> <strong>Group</strong> bagged the following orders:OrderWater TreatmentProjectOffshoreConstructionProcess PlantPipeline ProjectConstructionEPC ContractProcess PlantWater TreatmentProjectConstructionConstructionProcess PlantConstructionProcess PlantSolar UtilityDetailEPC contract from Petroleum Company Occidental, Mukhaizna fornew water treatment plant at the oil production fields in OmanEPCIC order from Indonesian oil company Pertamina for three wellhead platforms <strong>and</strong> laying three segments of offshore gas pipelinealong with „wye‟ installationCivil contract for two commercial buildings within Hiran<strong>and</strong>ani PalaceGardens, a township by Hirco <strong>Group</strong>.Repeat order from Paradip Refinery, India, for Mechanical <strong>and</strong> Pipingfor FCC <strong>and</strong> PRU unitsRepeat order for Onshore Gas Pipeline in Thail<strong>and</strong> from PTT PublicCompany Limited in Thail<strong>and</strong>.Civil contract from West Bengal Medical Services Corporation Limited(WBMSC) for planning, design <strong>and</strong> construction of three MedicalColleges in West BengalEPC contract of a new oil storage complex at Ras Lanuf ExportTerminal from Harouge Oil Operations in LibyaEPC order from Indian Oil Limited for Paradip Refinery Project forKero Treatment UnitProject from PUB, the national water agency of Singapore forconstruction of a new waterworks by SembawangContract from Resorts World Sentosa, Singapore to construct hotel,villas, marine life park <strong>and</strong> water theme parkContract from Rajiv G<strong>and</strong>hi Institute of Petroleum Technology toconstruct the institute complex <strong>and</strong> site in Rai BareliEPC contract for the Shah Gas Development project in Abu Dhabi toexecute the Gas Gathering Package for the projectContract from the Ministry of Health & Family Welfare for constructionof Medical College <strong>and</strong> Hospital Complex at AIIMS, RaipurOrder for Cuddalore Refinery Project of Nagarjuna Oil Corporation Ltd.in Tamil Nadu.India’s largest solar – based EPC contract from the Public HealthEngineering Department of the Government of BiharValue(Rs. million)3,2262,7102,4111,69012,9921,8362,87611,2326,14013,9441,79920,5601,1523,2002,328