Are Psychotic Psychopathology and Neurocognition ... - Caphri
Are Psychotic Psychopathology and Neurocognition ... - Caphri
Are Psychotic Psychopathology and Neurocognition ... - Caphri

Create successful ePaper yourself
Turn your PDF publications into a flip-book with our unique Google optimized e-Paper software.
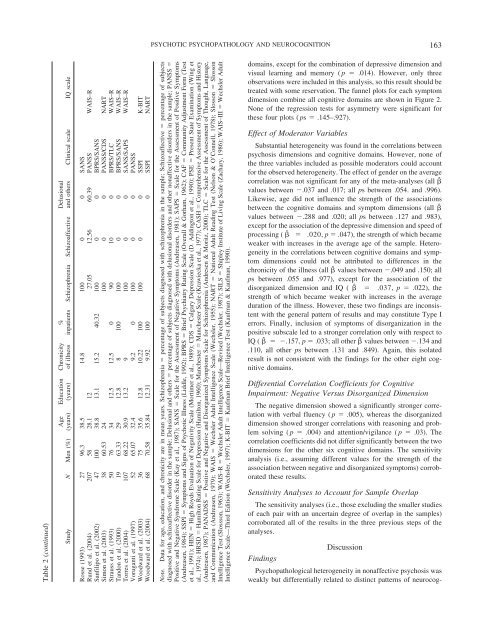
PSYCHOTIC PSYCHOPATHOLOGY AND NEUROCOGNITION163Table 2 (continued)Delusional<strong>and</strong> others Clinical scale IQ scale%inpatients Schizophrenia SchizoaffectiveChronicityof illnessEducation(years)Age(years)Study N Men (%)Rosse (1993) 27 96.3 38.5 14.8 100 0 0 SANSRund et al. (2004) 207 58 28.1 12 27.05 12.56 60.39 PANSS WAIS–RSanfilipo et al. (2002) 47 100 38.8 13.1 15.2 40.32 100 0 0 BPRS/SANSSimon et al. (2003) 38 60.53 24 100 0 0 PANSS/CDS NARTStrauss et al. (1993) 50 76 34 12.5 12.5 0 90 10 0 BPRS/TLC WAIS–RT<strong>and</strong>on et al. (2000) 19 63.33 29 12.8 8 100 100 0 0 BPRS/SANS WAIS–RTorres et al. (2004) 107 68.22 30.9 13.2 9 100 0 0 SANS/SAPS WAIS–RVoruganti et al. (1997) 52 65.07 32.4 9.2 0 100 0 0 PANSSWoodward et al. (2003) 36 75 35.6 12.8 10.22 100 100 0 0 SSPI K-BITWoodward et al. (2004) 68 70.58 35.84 12.31 9.92 100 0 SSPI NARTNote. Data for age, education, <strong>and</strong> chronicity are in mean years. Schizophrenia percentage of subjects diagnosed with schizophrenia in the sample; Schizoaffective percentage of subjectsdiagnosed with schizoaffective disorder in the sample; Delusional <strong>and</strong> others percentage of subjects diagnosed with delusional disorders <strong>and</strong> other nonaffective disorders in the sample; PANSS Positive <strong>and</strong> Negative Syndrome Scale (Kay et al., 1987); SANS Scale for the Assessment of Negative Symptoms (Andreasen, 1981); SAPS Scale for the Assessment of Positive Symptoms(Andreasen, 1984); SSPI Symptoms <strong>and</strong> Signs of <strong>Psychotic</strong> Illness (Liddle, 1992); BPRS Brief Psychiatry Rating Scale (Overall & Gorham, 1962); CAF Community Adjustment Form (Testet al., 1991); HEN High Royds Evaluation of Negativity Scale (Mortimer et al., 1989); CDS Calgary Depression Scale (D. Addington et al., 1990); PSE Present State Examination (Wing etal., 1974); HRSD Hamilton Rating Scale for Depression (Hamilton, 1960); Manchester Manchester Scale (Krawiecka et al., 1977); CASH Comprehensive Assessment of Symptoms <strong>and</strong> History(Andreasen, 1987); PANADSS Positive <strong>and</strong> Negative <strong>and</strong> Disorganized Symptoms Scale for Schizophrenia (Andresen & Moritz, 2000); TLC Scale for the Assessment of Thought, Language,<strong>and</strong> Communication (Andreasen, 1979); WAIS Wechsler Adult Intelligence Scale (Wechsler, 1955); NART National Adult Reading Test (Nelson & O’Connell, 1978); Slosson SlossonIntelligence Test (Slossson, 1963); WAIS–R Wechsler Adult Intelligence Scale—Revised (Wechsler, 1987); SILS Shipley Institute of Living Scale (Zachary, 1986); WAIS–III Wechsler AdultIntelligence Scale—Third Edition (Wechsler, 1997); K-BIT Kaufman Brief Intelligence Test (Kaufman & Kaufman, 1990).domains, except for the combination of depressive dimension <strong>and</strong>visual learning <strong>and</strong> memory ( p .014). However, only threeobservations were included in this analysis, so this result should betreated with some reservation. The funnel plots for each symptomdimension combine all cognitive domains are shown in Figure 2.None of the regression tests for asymmetry were significant forthese four plots ( ps .145–.927).Effect of Moderator VariablesSubstantial heterogeneity was found in the correlations betweenpsychosis dimensions <strong>and</strong> cognitive domains. However, none ofthe three variables included as possible moderators could accountfor the observed heterogeneity. The effect of gender on the averagecorrelation was not significant for any of the meta-analyses (all ˆvalues between .037 <strong>and</strong> .017; all ps between .054. <strong>and</strong> .996).Likewise, age did not influence the strength of the associationsbetween the cognitive domains <strong>and</strong> symptom dimensions (all ˆvalues between .288 <strong>and</strong> .020; all ps between .127 <strong>and</strong> .983),except for the association of the depressive dimension <strong>and</strong> speed ofprocessing ( ˆ .020, p .047), the strength of which becameweaker with increases in the average age of the sample. Heterogeneityin the correlations between cognitive domains <strong>and</strong> symptomdimensions could not be attributed to differences in thechronicity of the illness (all ˆ values between .049 <strong>and</strong> .150; allps between .055 <strong>and</strong> .977), except for the association of thedisorganized dimension <strong>and</strong> IQ ( ˆ .037, p .022), thestrength of which became weaker with increases in the averageduration of the illness. However, these two findings are inconsistentwith the general pattern of results <strong>and</strong> may constitute Type Ierrors. Finally, inclusion of symptoms of disorganization in thepositive subscale led to a stronger correlation only with respect toIQ ( ˆ .157, p .033; all other ˆ values between .134 <strong>and</strong>.110, all other ps between .131 <strong>and</strong> .849). Again, this isolatedresult is not consistent with the findings for the other eight cognitivedomains.Differential Correlation Coefficients for CognitiveImpairment: Negative Versus Disorganized DimensionThe negative dimension showed a significantly stronger correlationwith verbal fluency ( p .005), whereas the disorganizeddimension showed stronger correlations with reasoning <strong>and</strong> problemsolving ( p .004) <strong>and</strong> attention/vigilance ( p .03). Thecorrelation coefficients did not differ significantly between the twodimensions for the other six cognitive domains. The sensitivityanalysis (i.e., assuming different values for the strength of theassociation between negative <strong>and</strong> disorganized symptoms) corroboratedthese results.Sensitivity Analyses to Account for Sample OverlapThe sensitivity analyses (i.e., those excluding the smaller studiesof each pair with an uncertain degree of overlap in the samples)corroborated all of the results in the three previous steps of theanalyses.DiscussionFindingsPsychopathological heterogeneity in nonaffective psychosis wasweakly but differentially related to distinct patterns of neurocog-