Dimensions of variation on the CORE-OM - Paul Barrett
Dimensions of variation on the CORE-OM - Paul Barrett
Dimensions of variation on the CORE-OM - Paul Barrett

You also want an ePaper? Increase the reach of your titles
YUMPU automatically turns print PDFs into web optimized ePapers that Google loves.
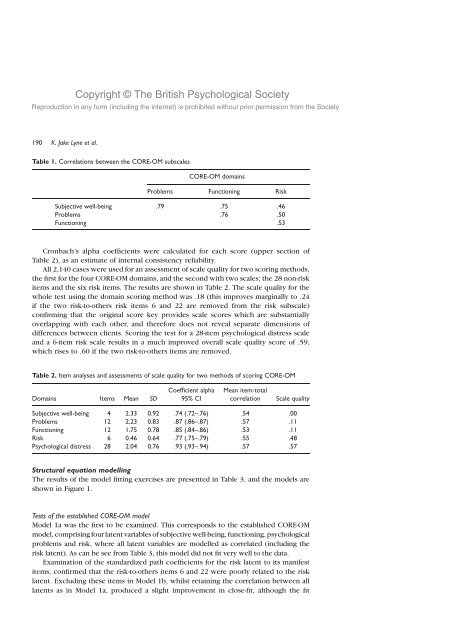
Copyright © The British Psychological SocietyReproducti<strong>on</strong> in any form (including <strong>the</strong> internet) is prohibited without prior permissi<strong>on</strong> from <strong>the</strong> Society190K. Jake Lyne et al.Table 1. Correlati<strong>on</strong>s between <strong>the</strong> <strong>CORE</strong>-<strong>OM</strong> subscales<strong>CORE</strong>-<strong>OM</strong> domainsProblems Functi<strong>on</strong>ing RiskSubjective well-being .79 .75 .46Problems .76 .50Functi<strong>on</strong>ing .53Cr<strong>on</strong>bach’s alpha coefficients were calculated for each score (upper secti<strong>on</strong> <str<strong>on</strong>g>of</str<strong>on</strong>g>Table 2), as an estimate <str<strong>on</strong>g>of</str<strong>on</strong>g> internal c<strong>on</strong>sistency reliability.All 2,140 cases were used for an assessment <str<strong>on</strong>g>of</str<strong>on</strong>g> scale quality for two scoring methods,<strong>the</strong> first for <strong>the</strong> four <strong>CORE</strong>-<strong>OM</strong> domains, and <strong>the</strong> sec<strong>on</strong>d with two scales; <strong>the</strong> 28 n<strong>on</strong>-riskitems and <strong>the</strong> six risk items. The results are shown in Table 2. The scale quality for <strong>the</strong>whole test using <strong>the</strong> domain scoring method was .18 (this improves marginally to .24if <strong>the</strong> two risk-to-o<strong>the</strong>rs risk items 6 and 22 are removed from <strong>the</strong> risk subscale)c<strong>on</strong>firming that <strong>the</strong> original score key provides scale scores which are substantiallyoverlapping with each o<strong>the</strong>r, and <strong>the</strong>refore does not reveal separate dimensi<strong>on</strong>s <str<strong>on</strong>g>of</str<strong>on</strong>g>differences between clients. Scoring <strong>the</strong> test for a 28-item psychological distress scaleand a 6-item risk scale results in a much improved overall scale quality score <str<strong>on</strong>g>of</str<strong>on</strong>g> .59,which rises to .60 if <strong>the</strong> two risk-to-o<strong>the</strong>rs items are removed.Table 2. Item analyses and assessments <str<strong>on</strong>g>of</str<strong>on</strong>g> scale quality for two methods <str<strong>on</strong>g>of</str<strong>on</strong>g> scoring <strong>CORE</strong>-<strong>OM</strong>Domains Items Mean SDCoefficient alpha95% CIMean item-totalcorrelati<strong>on</strong>Scale qualitySubjective well-being 4 2.33 0.92 .74 (.72–.76) .54 .00Problems 12 2.23 0.83 .87 (.86–.87) .57 .11Functi<strong>on</strong>ing 12 1.75 0.78 .85 (.84–.86) .53 .11Risk 6 0.46 0.64 .77 (.75–.79) .55 .48Psychological distress 28 2.04 0.76 .93 (.93–.94) .57 .57Structural equati<strong>on</strong> modellingThe results <str<strong>on</strong>g>of</str<strong>on</strong>g> <strong>the</strong> model fitting exercises are presented in Table 3, and <strong>the</strong> models areshown in Figure 1.Tests <str<strong>on</strong>g>of</str<strong>on</strong>g> <strong>the</strong> established <strong>CORE</strong>-<strong>OM</strong> modelModel 1a was <strong>the</strong> first to be examined. This corresp<strong>on</strong>ds to <strong>the</strong> established <strong>CORE</strong>-<strong>OM</strong>model, comprising four latent variables <str<strong>on</strong>g>of</str<strong>on</strong>g> subjective well-being, functi<strong>on</strong>ing, psychologicalproblems and risk, where all latent variables are modelled as correlated (including <strong>the</strong>risk latent). As can be see from Table 3, this model did not fit very well to <strong>the</strong> data.Examinati<strong>on</strong> <str<strong>on</strong>g>of</str<strong>on</strong>g> <strong>the</strong> standardized path coefficients for <strong>the</strong> risk latent to its manifestitems, c<strong>on</strong>firmed that <strong>the</strong> risk-to-o<strong>the</strong>rs items 6 and 22 were poorly related to <strong>the</strong> risklatent. Excluding <strong>the</strong>se items in Model 1b, whilst retaining <strong>the</strong> correlati<strong>on</strong> between alllatents as in Model 1a, produced a slight improvement in close-fit, although <strong>the</strong> fit