space and growth: a survey of empirical evidence ... - ResearchGate
space and growth: a survey of empirical evidence ... - ResearchGate
space and growth: a survey of empirical evidence ... - ResearchGate

Create successful ePaper yourself
Turn your PDF publications into a flip-book with our unique Google optimized e-Paper software.
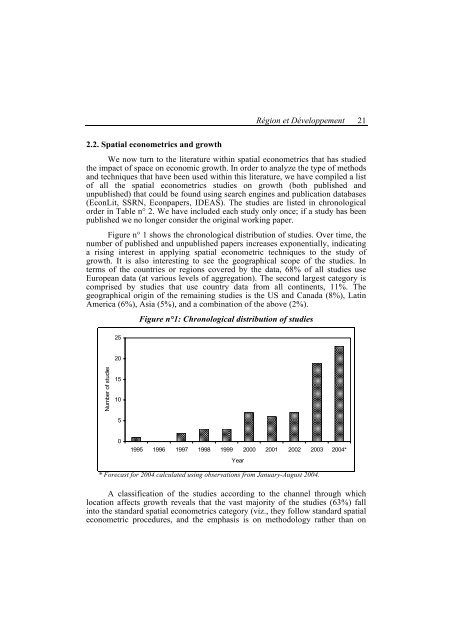
Région et Développement 212.2. Spatial econometrics <strong>and</strong> <strong>growth</strong>We now turn to the literature within spatial econometrics that has studiedthe impact <strong>of</strong> <strong>space</strong> on economic <strong>growth</strong>. In order to analyze the type <strong>of</strong> methods<strong>and</strong> techniques that have been used within this literature, we have compiled a list<strong>of</strong> all the spatial econometrics studies on <strong>growth</strong> (both published <strong>and</strong>unpublished) that could be found using search engines <strong>and</strong> publication databases(EconLit, SSRN, Econpapers, IDEAS). The studies are listed in chronologicalorder in Table n° 2. We have included each study only once; if a study has beenpublished we no longer consider the original working paper.Figure n° 1 shows the chronological distribution <strong>of</strong> studies. Over time, thenumber <strong>of</strong> published <strong>and</strong> unpublished papers increases exponentially, indicatinga rising interest in applying spatial econometric techniques to the study <strong>of</strong><strong>growth</strong>. It is also interesting to see the geographical scope <strong>of</strong> the studies. Interms <strong>of</strong> the countries or regions covered by the data, 68% <strong>of</strong> all studies useEuropean data (at various levels <strong>of</strong> aggregation). The second largest category iscomprised by studies that use country data from all continents, 11%. Thegeographical origin <strong>of</strong> the remaining studies is the US <strong>and</strong> Canada (8%), LatinAmerica (6%), Asia (5%), <strong>and</strong> a combination <strong>of</strong> the above (2%).Figure n°1: Chronological distribution <strong>of</strong> studies2520Number <strong>of</strong> studies1510501995 1996 1997 1998 1999 2000 2001 2002 2003 2004*Year* Forecast for 2004 calculated using observations from January-August 2004.A classification <strong>of</strong> the studies according to the channel through whichlocation affects <strong>growth</strong> reveals that the vast majority <strong>of</strong> the studies (63%) fallinto the st<strong>and</strong>ard spatial econometrics category (viz., they follow st<strong>and</strong>ard spatialeconometric procedures, <strong>and</strong> the emphasis is on methodology rather than on