gene pathway text mining and visualization - Artificial Intelligence ...
gene pathway text mining and visualization - Artificial Intelligence ...
gene pathway text mining and visualization - Artificial Intelligence ...

Create successful ePaper yourself
Turn your PDF publications into a flip-book with our unique Google optimized e-Paper software.
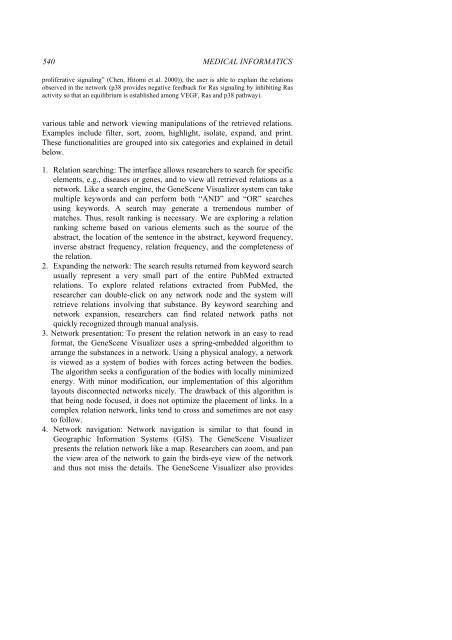
540 MEDICAL INFORMATICSproliferative signaling” (Chen, Hitomi et al. 2000)), the user is able to explain the relationsobserved in the network (p38 provides negative feedback for Ras signaling by inhibiting Rasactivity so that an equilibrium is established among VEGF, Ras <strong>and</strong> p38 <strong>pathway</strong>).various table <strong>and</strong> network viewing manipulations of the retrieved relations.Examples include filter, sort, zoom, highlight, isolate, exp<strong>and</strong>, <strong>and</strong> print.These functionalities are grouped into six categories <strong>and</strong> explained in detailbelow.1. Relation searching: The interface allows researchers to search for specificelements, e.g., diseases or <strong>gene</strong>s, <strong>and</strong> to view all retrieved relations as anetwork. Like a search engine, the GeneScene Visualizer system can takemultiple keywords <strong>and</strong> can perform both “AND” <strong>and</strong> “OR” searchesusing keywords. A search may <strong>gene</strong>rate a tremendous number ofmatches. Thus, result ranking is necessary. We are exploring a relationranking scheme based on various elements such as the source of theabstract, the location of the sentence in the abstract, keyword frequency,inverse abstract frequency, relation frequency, <strong>and</strong> the completeness ofthe relation.2. Exp<strong>and</strong>ing the network: The search results returned from keyword searchusually represent a very small part of the entire PubMed extractedrelations. To explore related relations extracted from PubMed, theresearcher can double-click on any network node <strong>and</strong> the system willretrieve relations involving that substance. By keyword searching <strong>and</strong>network expansion, researchers can find related network paths notquickly recognized through manual analysis.3. Network presentation: To present the relation network in an easy to readformat, the GeneScene Visualizer uses a spring-embedded algorithm toarrange the substances in a network. Using a physical analogy, a networkis viewed as a system of bodies with forces acting between the bodies.The algorithm seeks a configuration of the bodies with locally minimizedenergy. With minor modification, our implementation of this algorithmlayouts disconnected networks nicely. The drawback of this algorithm isthat being node focused, it does not optimize the placement of links. In acomplex relation network, links tend to cross <strong>and</strong> sometimes are not easyto follow.4. Network navigation: Network navigation is similar to that found inGeographic Information Systems (GIS). The GeneScene Visualizerpresents the relation network like a map. Researchers can zoom, <strong>and</strong> panthe view area of the network to gain the birds-eye view of the network<strong>and</strong> thus not miss the details. The GeneScene Visualizer also provides