Dell Power Solutions
Dell Power Solutions
Dell Power Solutions

You also want an ePaper? Increase the reach of your titles
YUMPU automatically turns print PDFs into web optimized ePapers that Google loves.
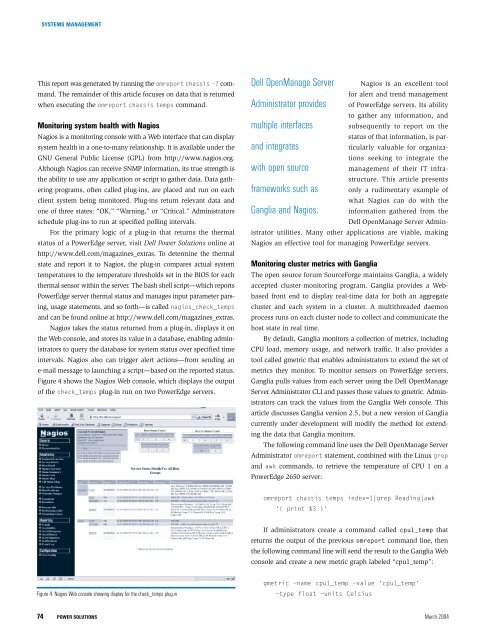
SYSTEMS MANAGEMENTThis report was generated by running the omreport chassis -? command.The remainder of this article focuses on data that is returnedwhen executing the omreport chassis temps command.Monitoring system health with NagiosNagios is a monitoring console with a Web interface that can displaysystem health in a one-to-many relationship. It is available under theGNU General Public License (GPL) from http://www.nagios.org.Although Nagios can receive SNMP information, its true strength isthe ability to use any application or script to gather data. Data gatheringprograms, often called plug-ins, are placed and run on eachclient system being monitored. Plug-ins return relevant data andone of three states: “OK,” “Warning,” or “Critical.” Administratorsschedule plug-ins to run at specified polling intervals.For the primary logic of a plug-in that returns the thermalstatus of a <strong>Power</strong>Edge server, visit <strong>Dell</strong> <strong>Power</strong> <strong>Solutions</strong> online athttp://www.dell.com/magazines_extras. To determine the thermalstate and report it to Nagios, the plug-in compares actual systemtemperatures to the temperature thresholds set in the BIOS for eachthermal sensor within the server. The bash shell script—which reports<strong>Power</strong>Edge server thermal status and manages input parameter parsing,usage statements, and so forth—is called nagios_check_tempsand can be found online at http://www.dell.com/magazines_extras.Nagios takes the status returned from a plug-in, displays it onthe Web console, and stores its value in a database, enabling administratorsto query the database for system status over specified timeintervals. Nagios also can trigger alert actions—from sending ane-mail message to launching a script—based on the reported status.Figure 4 shows the Nagios Web console, which displays the outputof the check_temps plug-in run on two <strong>Power</strong>Edge servers.<strong>Dell</strong> OpenManage ServerAdministrator providesmultiple interfacesand integrateswith open sourceframeworks such asGanglia and Nagios.Nagios is an excellent toolfor alert and trend managementof <strong>Power</strong>Edge servers. Its abilityto gather any information, andsubsequently to report on thestatus of that information, is particularlyvaluable for organizationsseeking to integrate themanagement of their IT infrastructure.This article presentsonly a rudimentary example ofwhat Nagios can do with theinformation gathered from the<strong>Dell</strong> OpenManage Server Administratorutilities. Many other applications are viable, makingNagios an effective tool for managing <strong>Power</strong>Edge servers.Monitoring cluster metrics with GangliaThe open source forum SourceForge maintains Ganglia, a widelyaccepted cluster-monitoring program. Ganglia provides a Webbasedfront end to display real-time data for both an aggregatecluster and each system in a cluster. A multithreaded daemonprocess runs on each cluster node to collect and communicate thehost state in real time.By default, Ganglia monitors a collection of metrics, includingCPU load, memory usage, and network traffic. It also provides atool called gmetric that enables administrators to extend the set ofmetrics they monitor. To monitor sensors on <strong>Power</strong>Edge servers,Ganglia pulls values from each server using the <strong>Dell</strong> OpenManageServer Administrator CLI and passes those values to gmetric. Administratorscan track the values from the Ganglia Web console. Thisarticle discusses Ganglia version 2.5, but a new version of Gangliacurrently under development will modify the method for extendingthe data that Ganglia monitors.The following command line uses the <strong>Dell</strong> OpenManage ServerAdministrator omreport statement, combined with the Linux grepand awk commands, to retrieve the temperature of CPU 1 on a<strong>Power</strong>Edge 2650 server:omreport chassis temps index=1|grep Reading|awk'{ print $3 }'If administrators create a command called cpu1_temp thatreturns the output of the previous omreport command line, thenthe following command line will send the result to the Ganglia Webconsole and create a new metric graph labeled “cpu1_temp”:Figure 4. Nagios Web console showing display for the check_temps plug-ingmetric —name cpu1_temp —value 'cpu1_temp'—type float —units Celsius74POWER SOLUTIONS March 2004