Energetics and genetics across the prokaryote ... - Biology Direct
Energetics and genetics across the prokaryote ... - Biology Direct
Energetics and genetics across the prokaryote ... - Biology Direct

Create successful ePaper yourself
Turn your PDF publications into a flip-book with our unique Google optimized e-Paper software.
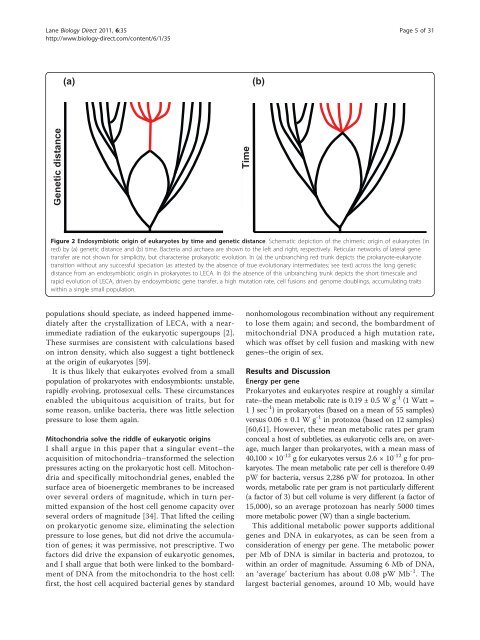
Lane <strong>Biology</strong> <strong>Direct</strong> 2011, 6:35http://www.biology-direct.com/content/6/1/35Page 5 of 31(a)(b)Genetic distanceTimeFigure 2 Endosymbiotic origin of eukaryotes by time <strong>and</strong> genetic distance. Schematic depiction of <strong>the</strong> chimeric origin of eukaryotes (inred) by (a) genetic distance <strong>and</strong> (b) time. Bacteria <strong>and</strong> archaea are shown to <strong>the</strong> left <strong>and</strong> right, respectively. Reticular networks of lateral genetransfer are not shown for simplicity, but characterise prokaryotic evolution. In (a) <strong>the</strong> unbranching red trunk depicts <strong>the</strong> <strong>prokaryote</strong>-eukaryotetransition without any successful speciation (as attested by <strong>the</strong> absence of true evolutionary intermediates; see text) <strong>across</strong> <strong>the</strong> long geneticdistance from an endosymbiotic origin in <strong>prokaryote</strong>s to LECA. In (b) <strong>the</strong> absence of this unbranching trunk depicts <strong>the</strong> short timescale <strong>and</strong>rapid evolution of LECA, driven by endosymbiotic gene transfer, a high mutation rate, cell fusions <strong>and</strong> genome doublings, accumulating traitswithin a single small population.populations should speciate, as indeed happened immediatelyafter <strong>the</strong> crystallization of LECA, with a nearimmediateradiation of <strong>the</strong> eukaryotic supergoups [2].These surmises are consistent with calculations basedon intron density, which also suggest a tight bottleneckat <strong>the</strong> origin of eukaryotes [59].It is thus likely that eukaryotes evolved from a smallpopulation of <strong>prokaryote</strong>s with endosymbionts: unstable,rapidly evolving, protosexual cells. These circumstancesenabled <strong>the</strong> ubiquitous acquisition of traits, but forsome reason, unlike bacteria, <strong>the</strong>re was little selectionpressure to lose <strong>the</strong>m again.Mitochondria solve <strong>the</strong> riddle of eukaryotic originsI shall argue in this paper that a singular event–<strong>the</strong>acquisition of mitochondria–transformed <strong>the</strong> selectionpressures acting on <strong>the</strong> prokaryotic host cell. Mitochondria<strong>and</strong> specifically mitochondrial genes, enabled <strong>the</strong>surface area of bioenergetic membranes to be increasedover several orders of magnitude, which in turn permittedexpansion of <strong>the</strong> host cell genome capacity overseveral orders of magnitude [34]. That lifted <strong>the</strong> ceilingon prokaryotic genome size, eliminating <strong>the</strong> selectionpressure to lose genes, but did not drive <strong>the</strong> accumulationof genes; it was permissive, not prescriptive. Twofactors did drive <strong>the</strong> expansion of eukaryotic genomes,<strong>and</strong> I shall argue that both were linked to <strong>the</strong> bombardmentof DNA from <strong>the</strong> mitochondria to <strong>the</strong> host cell:first, <strong>the</strong> host cell acquired bacterial genes by st<strong>and</strong>ardnonhomologous recombination without any requirementto lose <strong>the</strong>m again; <strong>and</strong> second, <strong>the</strong> bombardment ofmitochondrial DNA produced a high mutation rate,which was offset by cell fusion <strong>and</strong> masking with newgenes–<strong>the</strong> origin of sex.Results <strong>and</strong> DiscussionEnergy per geneProkaryotes <strong>and</strong> eukaryotes respire at roughly a similarrate–<strong>the</strong> mean metabolic rate is 0.19 ± 0.5 W g -1 (1 Watt =1 J sec -1 ) in <strong>prokaryote</strong>s (based on a mean of 55 samples)versus 0.06 ± 0.1 W g -1 in protozoa (based on 12 samples)[60,61]. However, <strong>the</strong>se mean metabolic rates per gramconceal a host of subtleties, as eukaryotic cells are, on average,much larger than <strong>prokaryote</strong>s, with a mean mass of40,100 × 10 -12 g for eukaryotes versus 2.6 × 10 -12 g for <strong>prokaryote</strong>s.The mean metabolic rate per cell is <strong>the</strong>refore 0.49pW for bacteria, versus 2,286 pW for protozoa. In o<strong>the</strong>rwords, metabolic rate per gram is not particularly different(a factor of 3) but cell volume is very different (a factor of15,000), so an average protozoan has nearly 5000 timesmore metabolic power (W) than a single bacterium.This additional metabolic power supports additionalgenes <strong>and</strong> DNA in eukaryotes, as can be seen from aconsideration of energy per gene. The metabolic powerper Mb of DNA is similar in bacteria <strong>and</strong> protozoa, towithin an order of magnitude. Assuming 6 Mb of DNA,an ‘average’ bacterium has about 0.08 pW Mb -1 .Thelargest bacterial genomes, around 10 Mb, would have