Relationship between Hardness Levels in Eslava Creek and ...
Relationship between Hardness Levels in Eslava Creek and ...
Relationship between Hardness Levels in Eslava Creek and ...
Create successful ePaper yourself
Turn your PDF publications into a flip-book with our unique Google optimized e-Paper software.
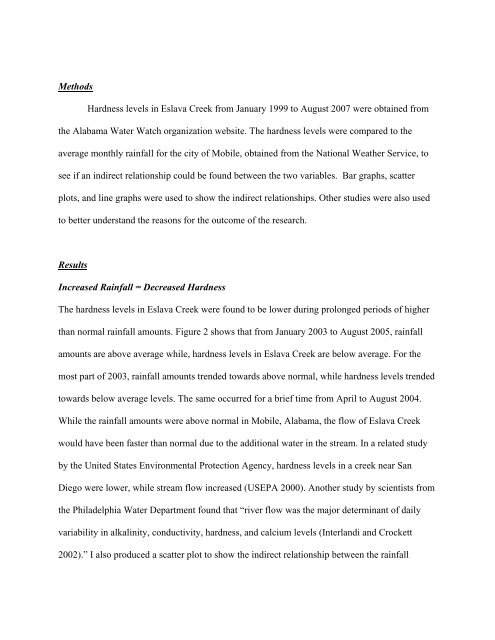
Methods<strong>Hardness</strong> levels <strong>in</strong> <strong>Eslava</strong> <strong>Creek</strong> from January 1999 to August 2007 were obta<strong>in</strong>ed fromthe Alabama Water Watch organization website. The hardness levels were compared to theaverage monthly ra<strong>in</strong>fall for the city of Mobile, obta<strong>in</strong>ed from the National Weather Service, tosee if an <strong>in</strong>direct relationship could be found <strong>between</strong> the two variables. Bar graphs, scatterplots, <strong>and</strong> l<strong>in</strong>e graphs were used to show the <strong>in</strong>direct relationships. Other studies were also usedto better underst<strong>and</strong> the reasons for the outcome of the research.ResultsIncreased Ra<strong>in</strong>fall = Decreased <strong>Hardness</strong>The hardness levels <strong>in</strong> <strong>Eslava</strong> <strong>Creek</strong> were found to be lower dur<strong>in</strong>g prolonged periods of higherthan normal ra<strong>in</strong>fall amounts. Figure 2 shows that from January 2003 to August 2005, ra<strong>in</strong>fallamounts are above average while, hardness levels <strong>in</strong> <strong>Eslava</strong> <strong>Creek</strong> are below average. For themost part of 2003, ra<strong>in</strong>fall amounts trended towards above normal, while hardness levels trendedtowards below average levels. The same occurred for a brief time from April to August 2004.While the ra<strong>in</strong>fall amounts were above normal <strong>in</strong> Mobile, Alabama, the flow of <strong>Eslava</strong> <strong>Creek</strong>would have been faster than normal due to the additional water <strong>in</strong> the stream. In a related studyby the United States Environmental Protection Agency, hardness levels <strong>in</strong> a creek near SanDiego were lower, while stream flow <strong>in</strong>creased (USEPA 2000). Another study by scientists fromthe Philadelphia Water Department found that “river flow was the major determ<strong>in</strong>ant of dailyvariability <strong>in</strong> alkal<strong>in</strong>ity, conductivity, hardness, <strong>and</strong> calcium levels (Interl<strong>and</strong>i <strong>and</strong> Crockett2002).” I also produced a scatter plot to show the <strong>in</strong>direct relationship <strong>between</strong> the ra<strong>in</strong>fall


